From the desk of Willie Delwiche.
Expert technical analysis of financial markets by JC Parets
From the desk of Willie Delwiche.
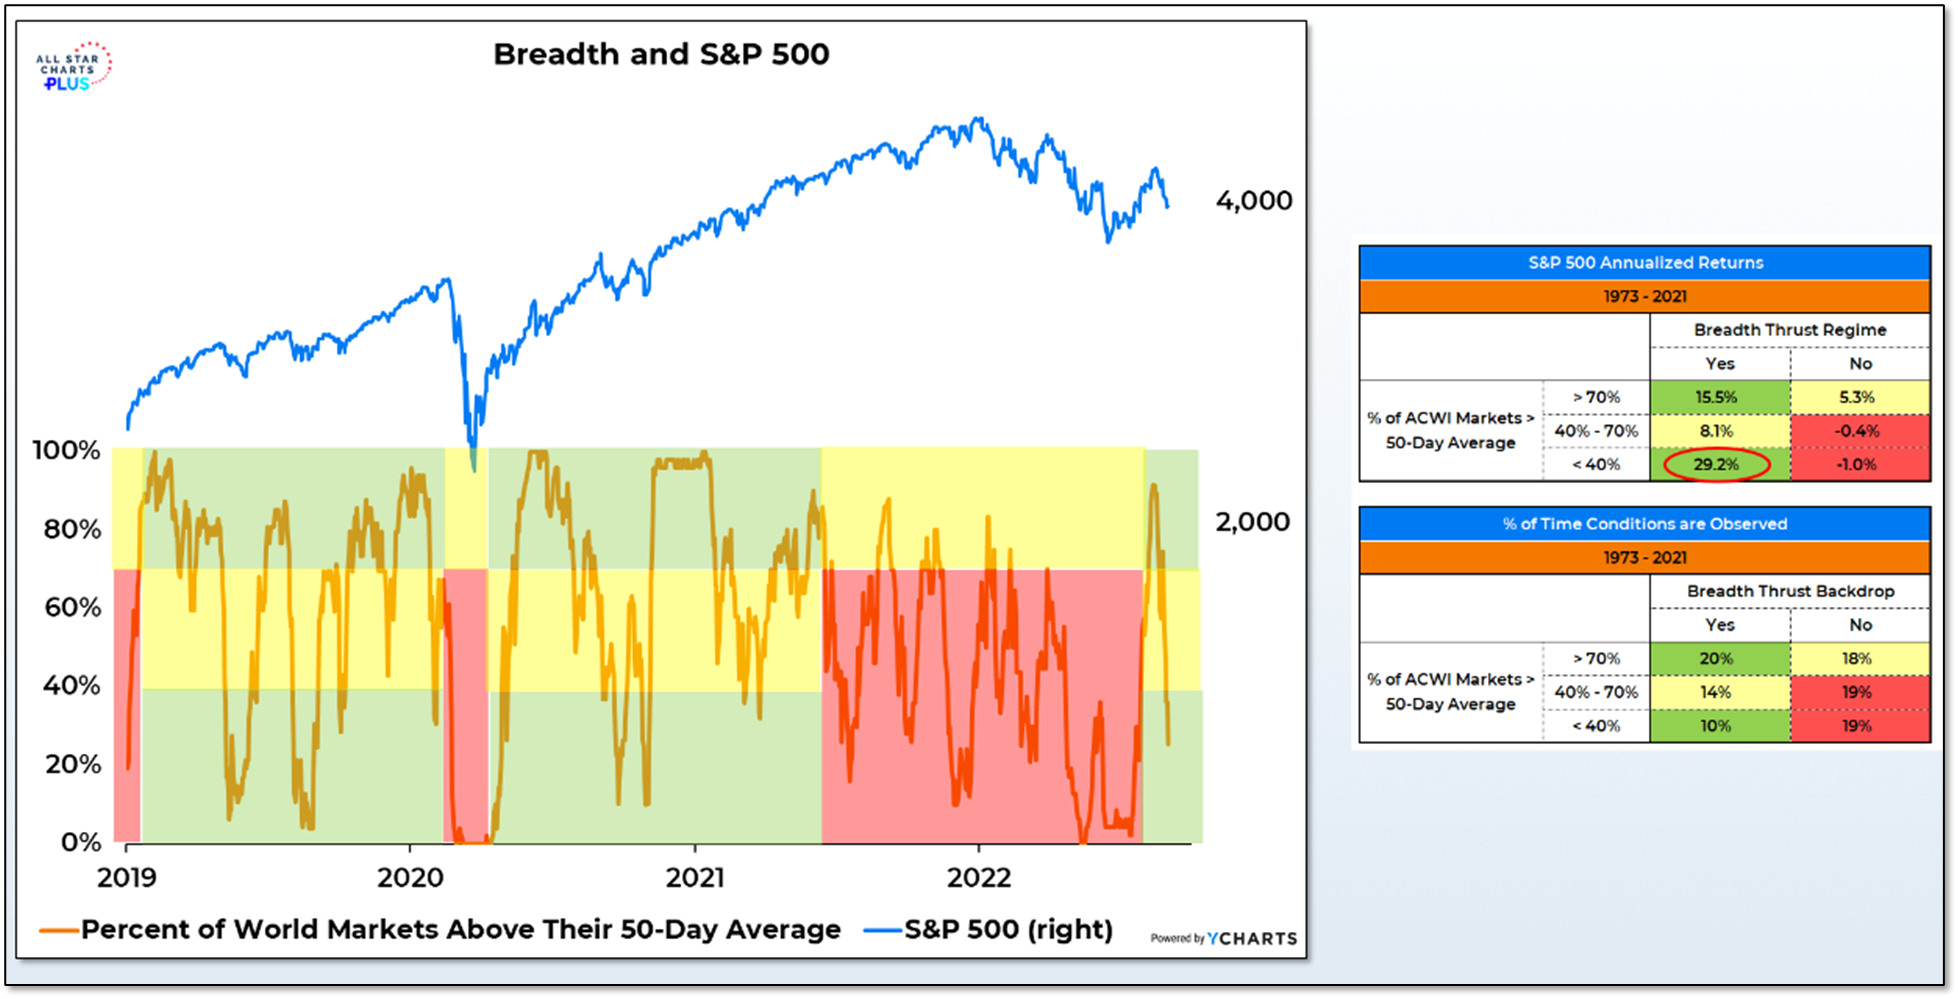
The late-July breadth thrust provides a breadth thrust regime that lasts for a year (or more if we get additional breadth thrusts between now and mid-2023). In such an environment, near-term oversold conditions tend not to persist and, in fact, reverse quite quickly. One way of measuring this is to look at the percentage of world markets trading above their 50-day average. Anything above 70% is pretty good participation, whether we are in a bullish breadth thrust regime or not. Below 40% is a different story. Without a breadth thrust as support, the S&P 500 struggles to make headway when the percentage of world markets above their 50-day average collapses. But within breadth thrust regimes, it signals an oversold condition that leads to strength.
The percentage of world markets above their 50-day average was at 90% in mid-August and is now down to just 25%. The recent breadth thrust suggests that rather than a red light arguing for caution, the signal now is a greenlight encouraging exposure.
This is the video recording of the September 1st, 2022, Weekly Town Hall w/ Willie Delwiche.
09/01/22 2:00 PM ET [Read more…]
From the desk of Willie Delwiche.
The first eight months of the year have been a grind.
A mid-month reversal in August took the S&P 500 from a 4% gain to 4% loss for the month and the early breadth and momentum thrusts now seem like a distant memory. Two-thirds of the way through the year and we are on track for the fewest days of more new highs than new lows observed in the past two decades, and 2022 is just ahead of 2020 (and lagging only 2009) in terms of daily swings of 1% or more on the S&P 500. Weakness in stocks this year has been exacerbated by weakness in bonds, as yields have climbed to new multi-year highs. The 60/40 stock/bond benchmark portfolio is down 14% through August.
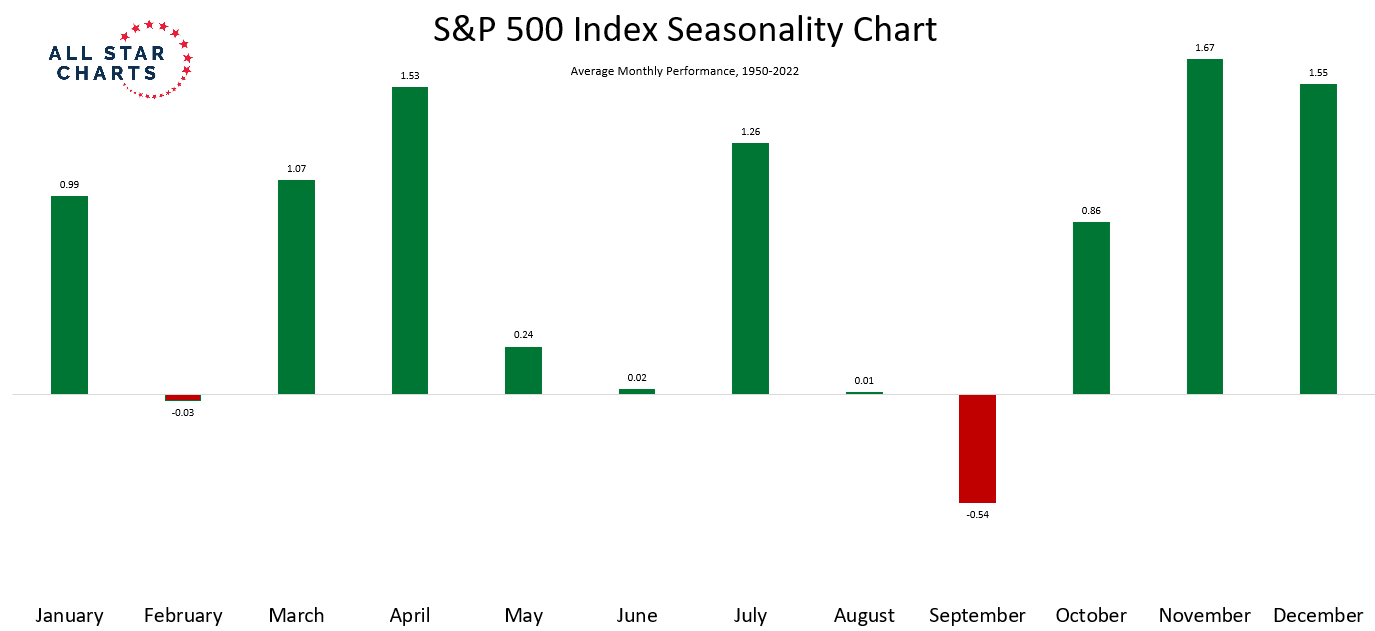
Welcome to September. If you haven’t heard, it’s the worst month of the year for stocks. Since 1950, only two months (February and September) have been down on average. This is a case were we don’t really need to focus on the exact numbers – the large red bar for September says it all:
From the desk of Willie Delwiche.
Key Takeaway: In July, consumer expectations for stocks dropped to their lowest level since March 2009. Excessive optimism is clearly not an issue for stocks right here. But bulls need to be resilient if the market is going to move higher. Recent breadth and momentum thrusts are fodder for optimism, but the persistent downtrend in stocks is dampening rally attempts. The latest numbers from AAII, II and NAAIM suggest questions about bullish resolve are well-founded. All have rolled over and are showing increased caution. If that continues, a broader re-set becomes more likely – one in which positioning (which has been resilient) gets more in line with sentiment.
Sentiment Report Chart of the Week: Expectations For Stocks Have Tanked
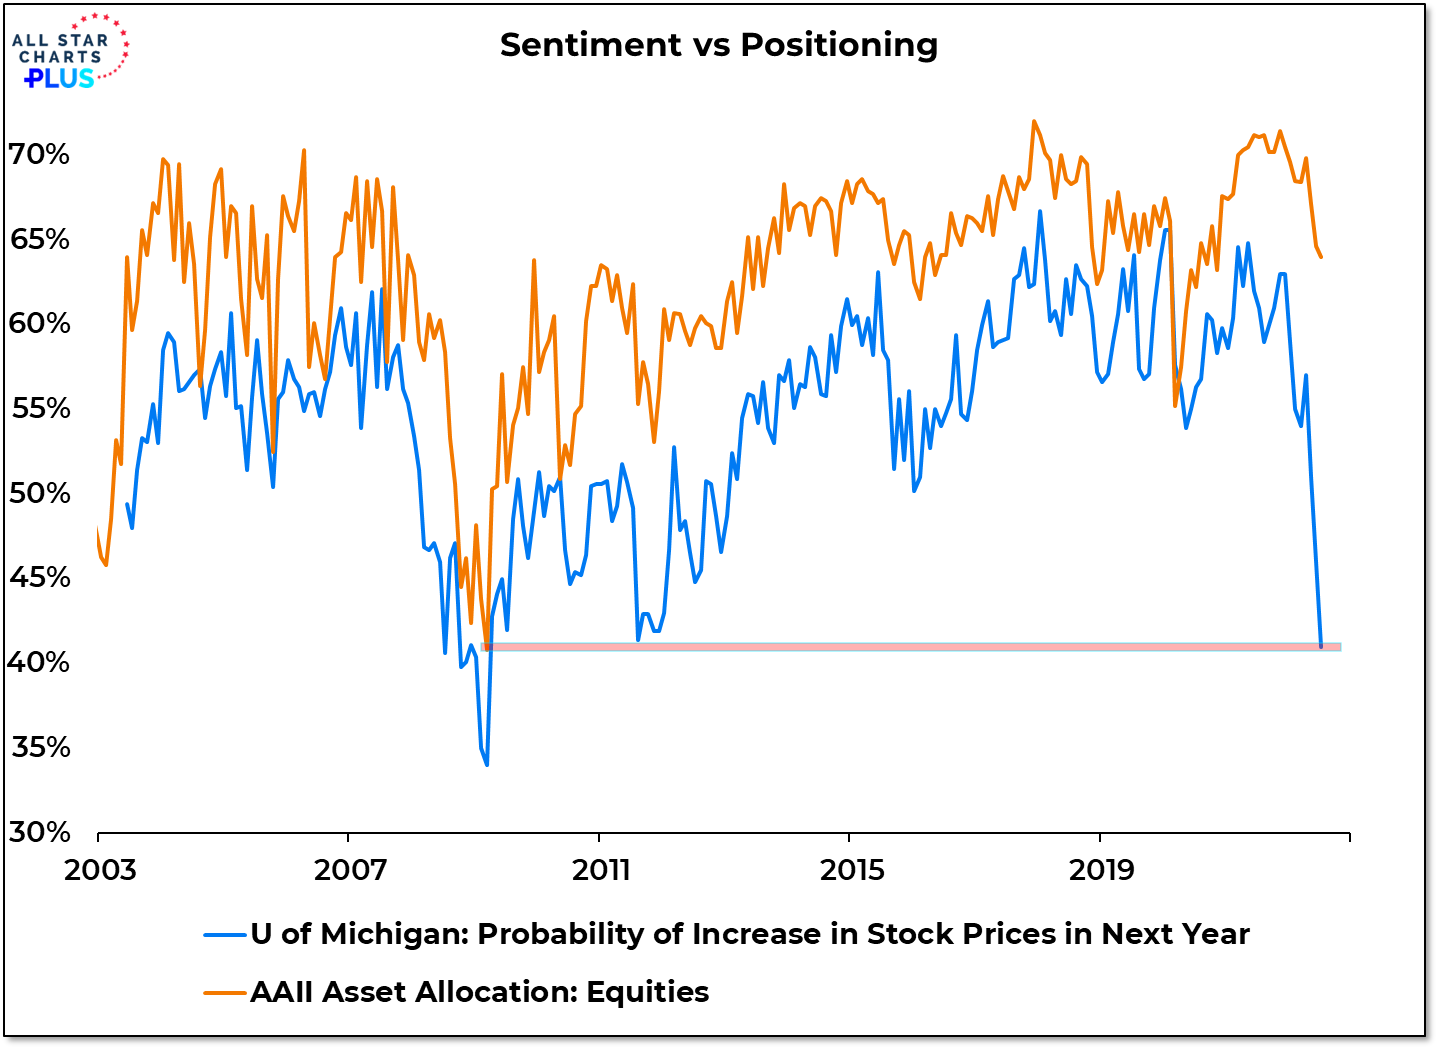
Among the questions asked in the University of Michigan Survey of Consumers is one regarding expectations about the direction of stocks over the coming year. Specifically it asks about the perceived likelihood that stocks will rise over the next 12 months. When that data for July was aggregated, it showed the smallest probability that stocks will move higher since March 2009. That is not too out of line with some of the other sentiment extremes witnessed earlier this summer. But it also highlights the continuing contrast between sentiment and positioning. In March of 2009, the AAII asset allocation survey showed 41% exposure to stocks. In July it was at 64%. Prior to this year, the correlation between these two surveys was better than 80%, but they were further apart than ever in July.
Key Takeaways:
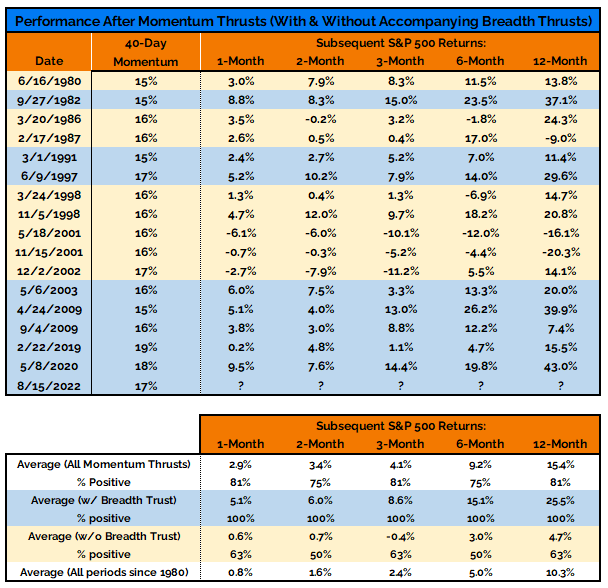
The mid-August momentum thrust was just two weeks ago, but it seems longer than that. The S&P 500 has gone from up 4% for the month to down 3% for the month, in the process giving back half of the entire rally off of the June lows. It is possible that the volatility environment produced false signals of strength, but we are not ready to jump to that conclusion. The combination momentum and breadth strength seen prior to the mid-month peak has been a typically reliable indicator that further strength lies ahead for stocks. Two weeks of price action is not enough for me to throw out 40-years worth of data.
That being said, the market could struggle to display the strength that these indicators have signaled in the past as long as we remain in a risk off environment. Moreover, the struggle for stocks is more acute when they are trending lower and bond yields are trending higher. If we see more red-lights flashing on our Macro Health Check we will need to re-evaluate our position, but for now I am inclined to trust the thrust.
Key Takeaway:
Our bull market re-birth checklist took a step backward but a tough labor does not preclude a successful delivery. Without new complications from a macro perspective, we are willing to be patient and trust the thrust. At the same time, however, so far this year stocks have yet to show that they can sustain strength when yields and the dollar are rising. If the market is taking the Fed at its word, then higher bond yields are likely to be seen this year, in the US and around the world. Japanese yields are again approaching the 0.25% level that the Bank of Japan has targeted as a ceiling for yields. When that happened in Q2, the yen suffered.
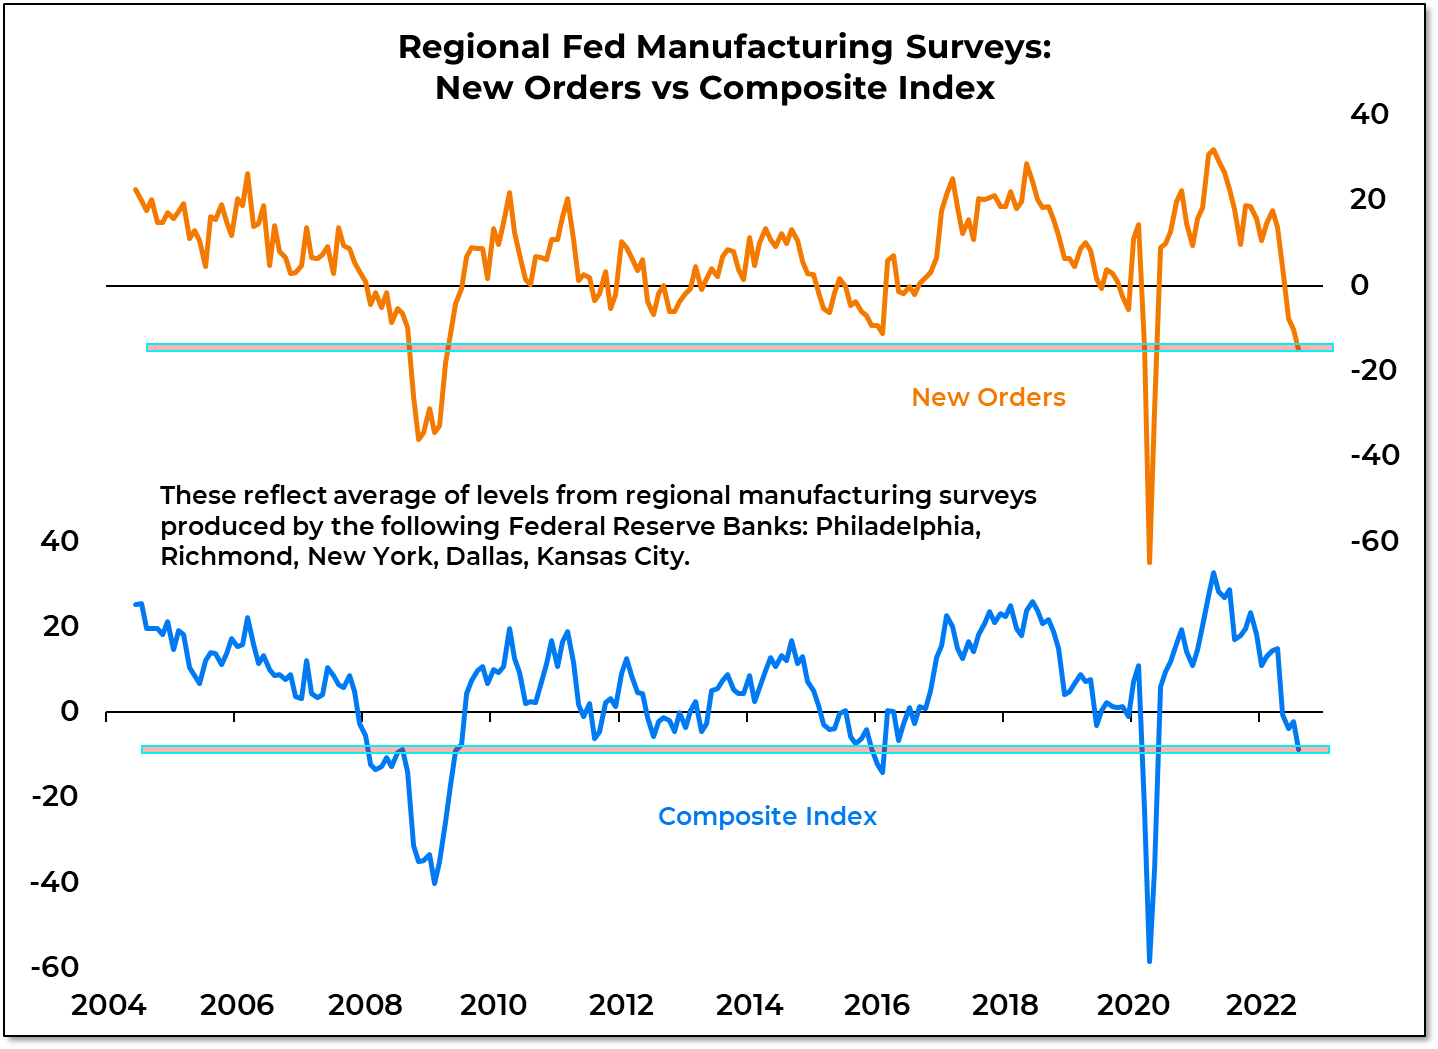
Beyond financial market fluctuations, the tough line from the Fed could be tested by economic realities this Fall. Regional Fed survey data shows new orders contracted in all five of regions for the second month in a row in August. The averages of both the new orders and overall composite indexes were negative for the third month in a row. In recent cycles, the Fed would be cutting rates at this point, but now it is talking tough about continuing to tighten. That does not mean that the market signals are wrong, but it does speak to a challenging macro backdrop.
From the desk of Willie Delwiche.
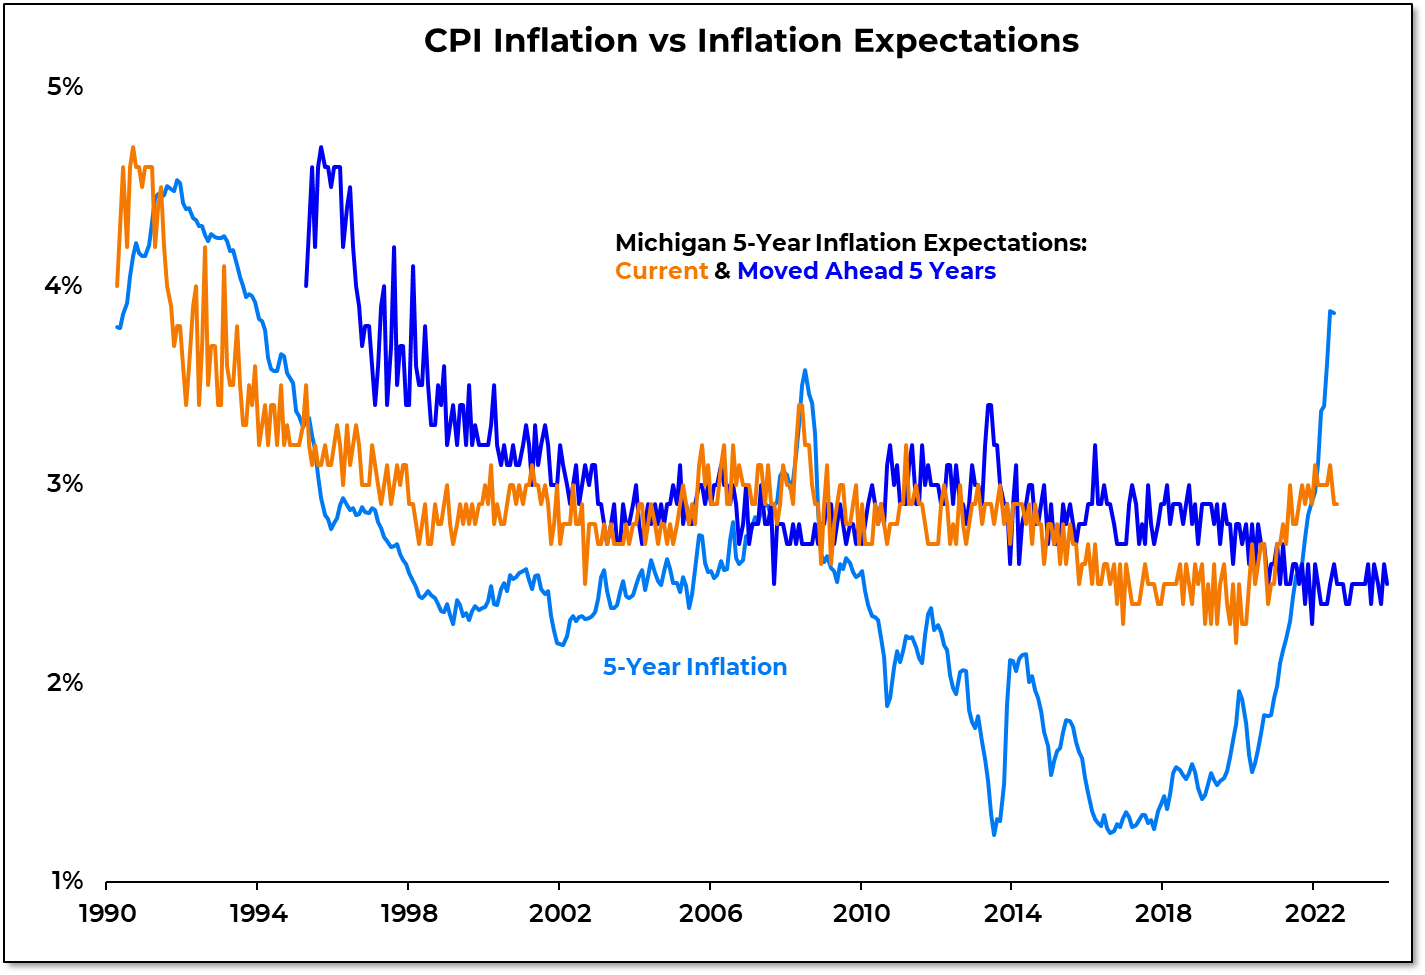
Fighting inflation is job number one for the Fed right now. Jerome Powell made that crystal clear in his remarks from Jackson Hole on Friday. He discussed the deleterious effects of inflation and the risks that come with prematurely claiming victory (and loosening policy). This could lead to more persistence in raising rates, more tolerance of economic weakness, and more willingness to keep rates high for an extended period of time. In this environment, inflation data will be scrutinized more than ever. While inflation expectations get a lot of focus, they are much more closely related to where inflation has been than where it is going. There is an 85% correlation between 5-year CPI inflation and current 5-year inflation expectations. That drops to just 26% when inflation expectations are moved ahead 5 years (so that the inflation data and expectations data are covering the same time period). If inflation stays high, expectations will become further unanchored. Alternative measures of inflation (like the median CPI from the Cleveland Fed and the trimmed-mean PCE from the Dallas Fed) show that the central tendency for inflation remains higher. The Fed is likely in for a long fight – the question from our perspective is whether this macro issues will overwhelm the positive market developments that we have been observing in recent weeks.