This is the weekly post that aggregates all the charts we put together throughout the week and organizes them all into one, easy to flip through deck.
Expert technical analysis of financial markets by JC Parets
This is the weekly post that aggregates all the charts we put together throughout the week and organizes them all into one, easy to flip through deck.
It’s the weekly commodity edition of What the FICC?
If you missed last month’s breakout in Sugar, have no fear: It’s offering us another opportunity to get long.…
Check it out!
These are the registration details for our Live Mid-month Conference Call for Premium Members of All Star Charts.
Our Live Call will be held on Tuesday February 21st at 6PM ET. As always, if you cannot make the call live, the video and slides will be archived and published here along with every other live call since 2015.
Here are the details for Tuesday night: [Read more…]
From the desk of Steve Strazza @Sstrazza and Alfonso Depablos @AlfCharts
Our International Hall of Famers list is composed of the 100 largest US-listed international stocks, or ADRs.
We’ve also sprinkled in some of the largest ADRs from countries that did not make the market cap cut.
These stocks range from some well-known mega-cap multinationals such as Toyota Motor and Royal Dutch Shell to some large-cap global disruptors such as Sea Ltd and Shopify.
It’s got all the big names and more–but only those that are based outside the US. You can find all the largest US stocks on our original Hall of Famers list.
The beauty of these scans is really in their simplicity.
We take the largest names each week and then apply technical filters in a way that the strongest stocks with the most momentum rise to the top.
Based on the market environment, we can also flip the scan on its head and filter for weakness.
Let’s dive in and take a look at some of the most important stocks from around the world.
From the Desk of Ian Culley @IanCulley
The New York Mercantile Exchange soft commodity contracts have been ripping.
Orange juice futures recently broke out of a decade-long base, coffee is up almost 20% in a month, and cocoa hit fresh 52-week highs yesterday.
Yet, of all the softs, I like sugar the most.
In fact, sugar held the No. 1 spot as my favorite chart heading into 2023. And it broke out last month!
I missed that move — not for lack of initiative, more like access issues.
If you missed it, too, have no fear: Sugar is offering us another opportunity to get long.…
From the Desk of Willie Delwiche.
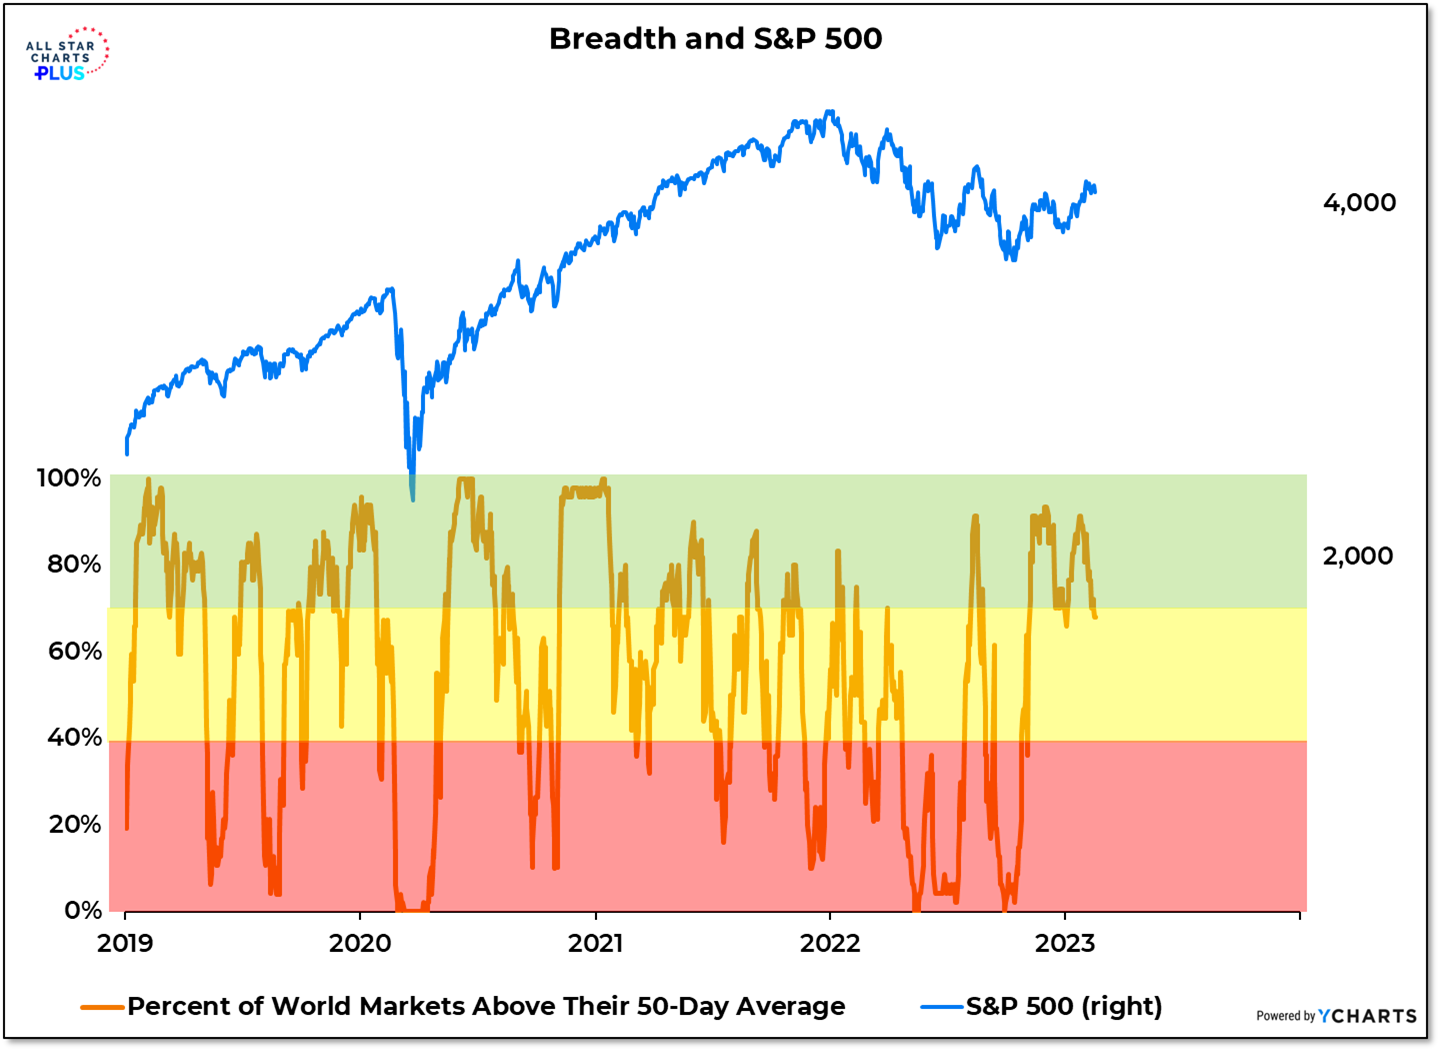
Prior to this week, we had seen just one day in the past three months with less than 70% of world markets above their 50-day averages. We’ve now had two days in a row with this indicator of global market strength in the yellow zone.
Why It Matters: The strongest markets have the broadest participation and historically the S&P 500 hasn’t run into much trouble as long as at least 70% of world markets are above their 50-day averages. Risks intensify when this drops below 40%. We discussed this (and other indicators of market stress) in our weekly Townhall as well as the Takeaways summary.
The Bottom Line is this: It’s not a red flag yet, but rally risks increase if fewer world markets are above their 50-day average and the dollar finding a bid after selling off in Q4 could challenge the strength we’ve seen around the world in recent months.
It’s the weekly bond edition of What the FICC?
Commodity-related stocks remain hot despite a narrative of easing inflation.
Check it out!