After reviewing the Cyclical Portfolio, we are making the active decision to sit on our hands for now. In the Tactical Opportunity Portfolio, we’ve made a couple of tweaks. We are seeing “Higher for longer” resonate with the bond market and are increasing exposure to one of the few areas that is actually still in an uptrend.
[PLUS] Weekly Market Perspectives – Trends Stymie Bullish Signals
Key Takeaways:
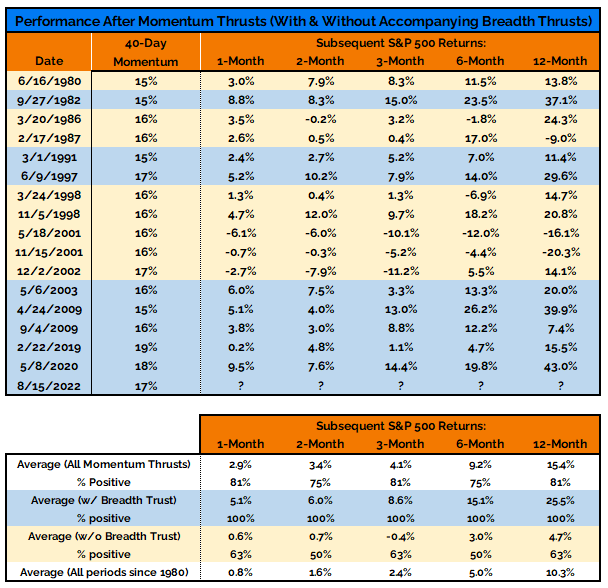
- Thrust signals are typically reliable indicators of strength
- Lack of risk appetite and rising yields working against stocks
- Without marked deterioration in macro health, we still trust the thrust
The mid-August momentum thrust was just two weeks ago, but it seems longer than that. The S&P 500 has gone from up 4% for the month to down 3% for the month, in the process giving back half of the entire rally off of the June lows. It is possible that the volatility environment produced false signals of strength, but we are not ready to jump to that conclusion. The combination momentum and breadth strength seen prior to the mid-month peak has been a typically reliable indicator that further strength lies ahead for stocks. Two weeks of price action is not enough for me to throw out 40-years worth of data.
That being said, the market could struggle to display the strength that these indicators have signaled in the past as long as we remain in a risk off environment. Moreover, the struggle for stocks is more acute when they are trending lower and bond yields are trending higher. If we see more red-lights flashing on our Macro Health Check we will need to re-evaluate our position, but for now I am inclined to trust the thrust.
[PLUS] Weekly Market Perspectives – Macro Risks Worth Watching
Key Takeaways:
- Risk On appetite missing from recent rally
- Bond yield momentum waning as financial stress remains low
- Intact dollar uptrend and rollover in copper/gold ratio are equity market obstacles
In the wake of the breadth and momentum thrusts seen over the first half of August, the market seems to be arguing that the path of least resistance is higher as we move into 2023. The macro backdrop almost guarantees that the way forward will be strewn with rocks and roots. The question is whether the obstacles will be significant enough to derail or delay the journey. We will look at several macro-related indicators that could help us anticipate a more or less treacherous road ahead.
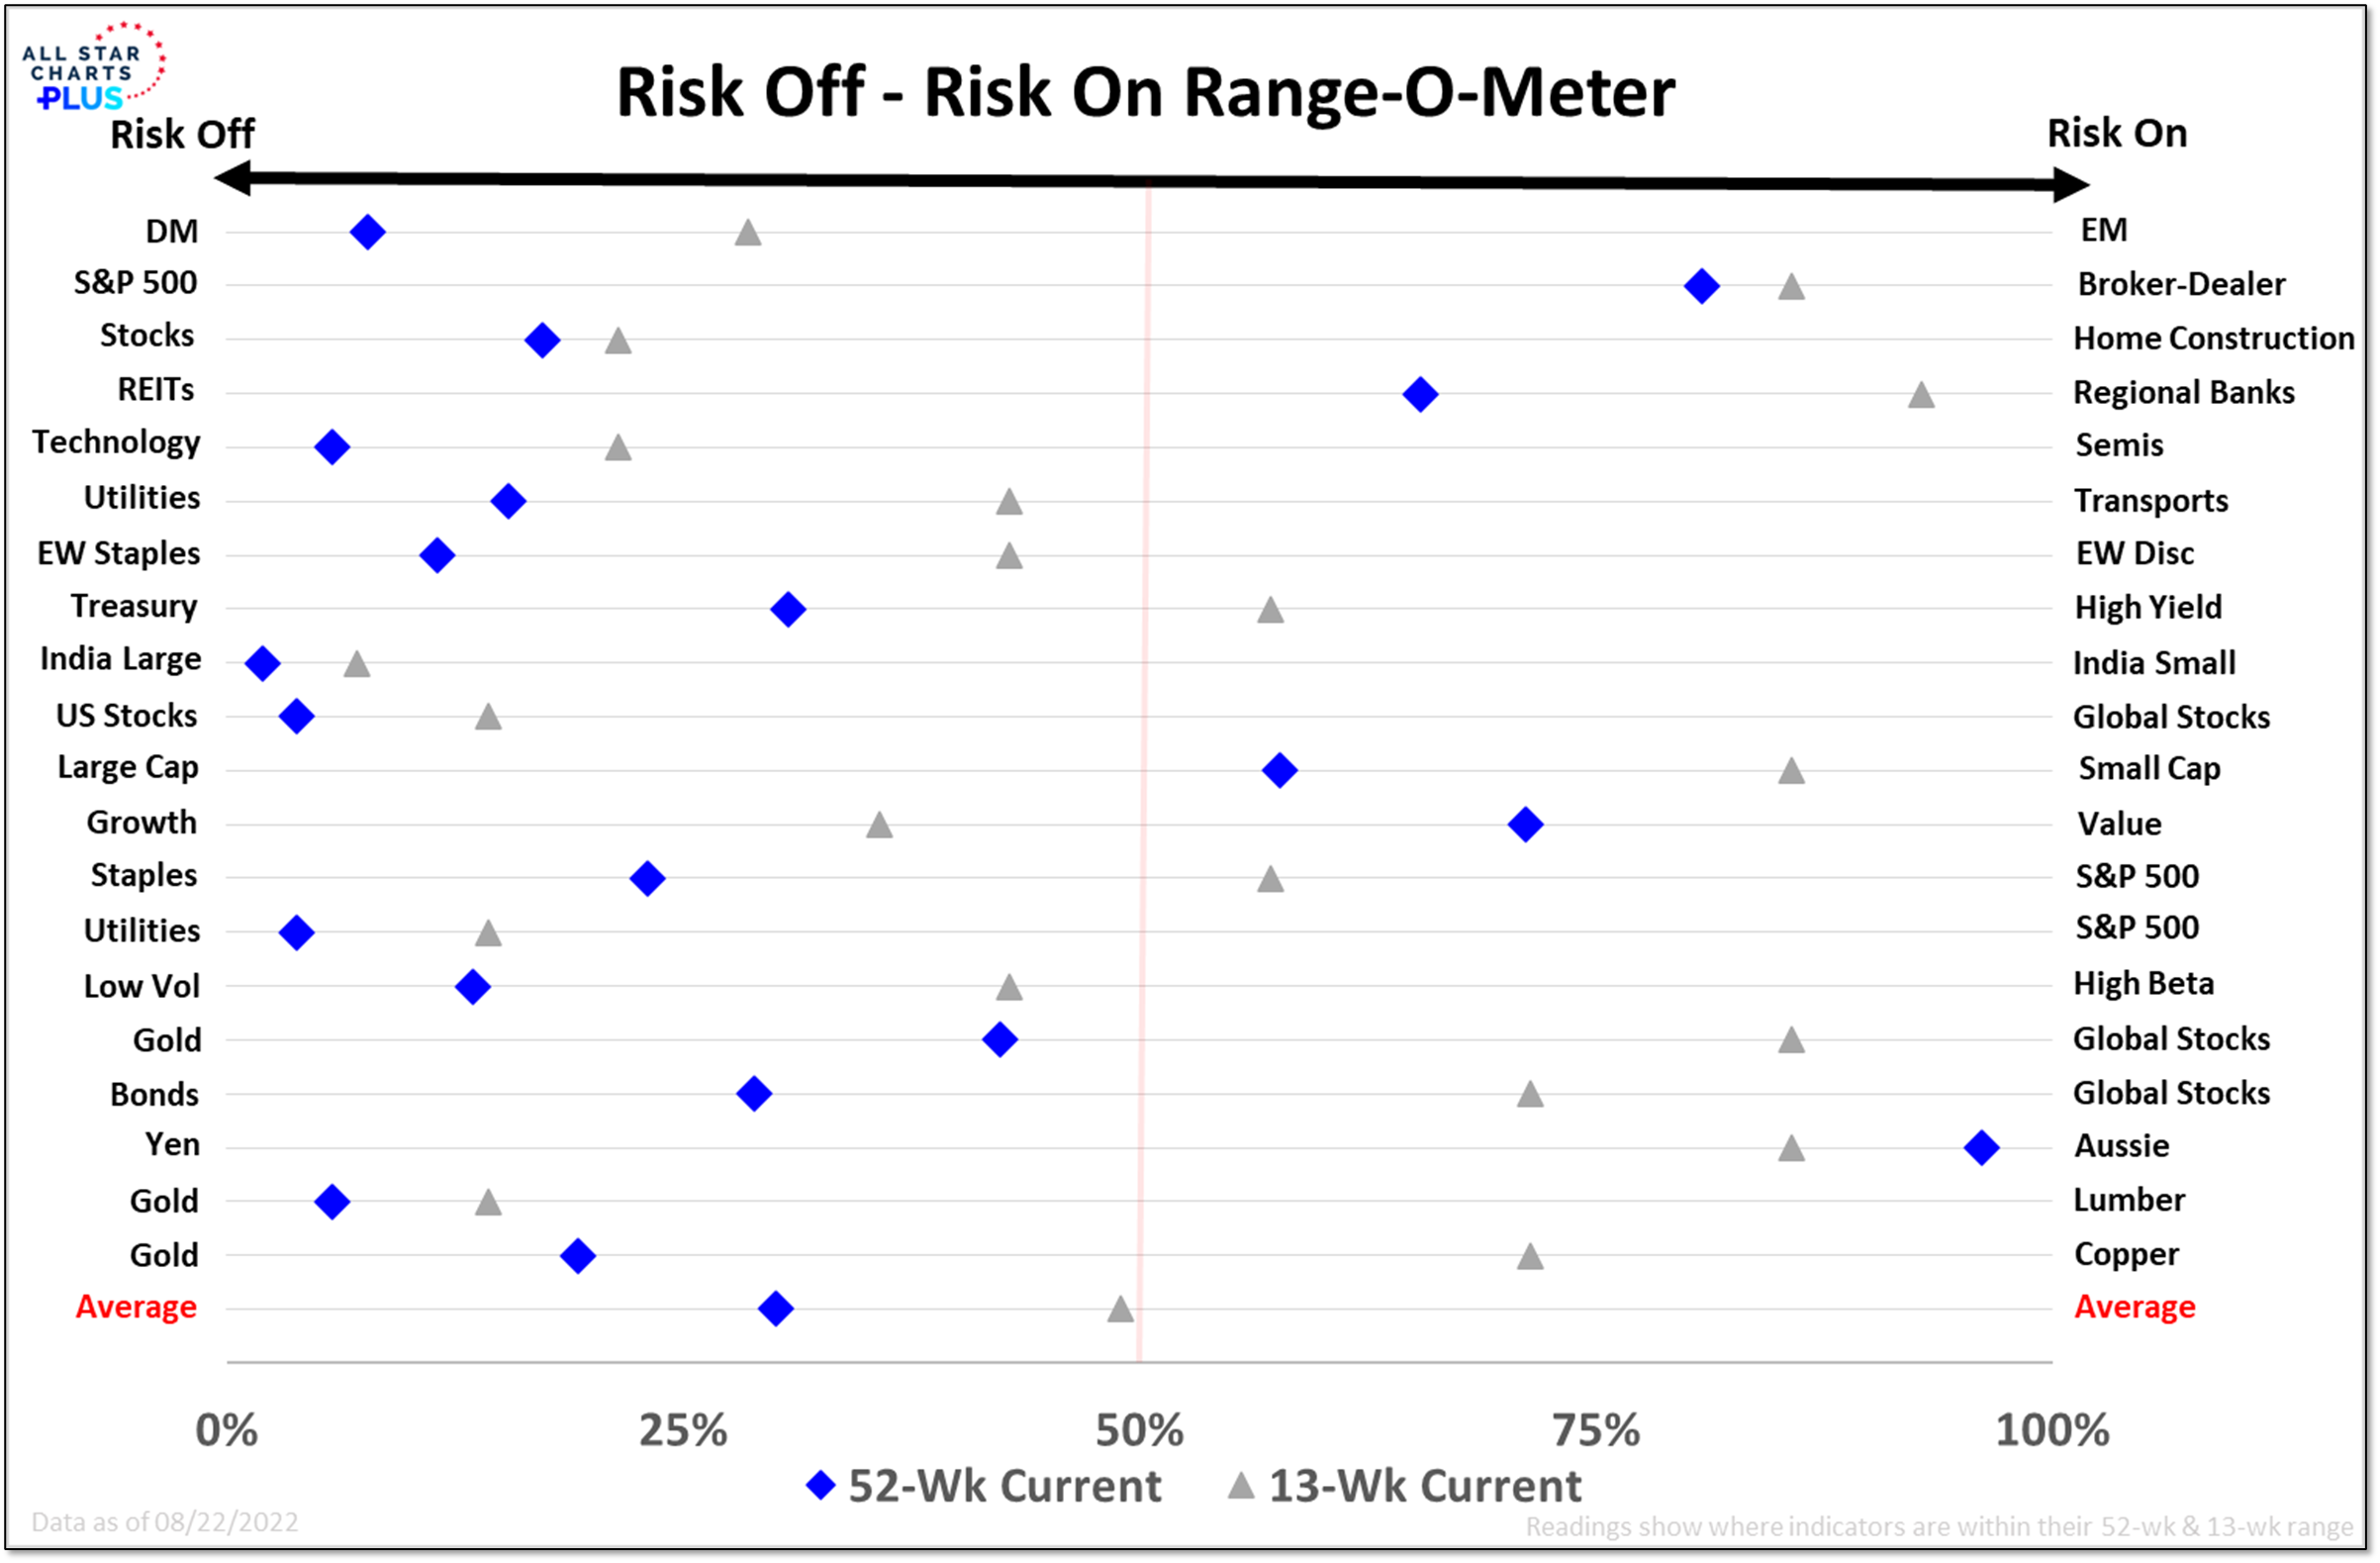
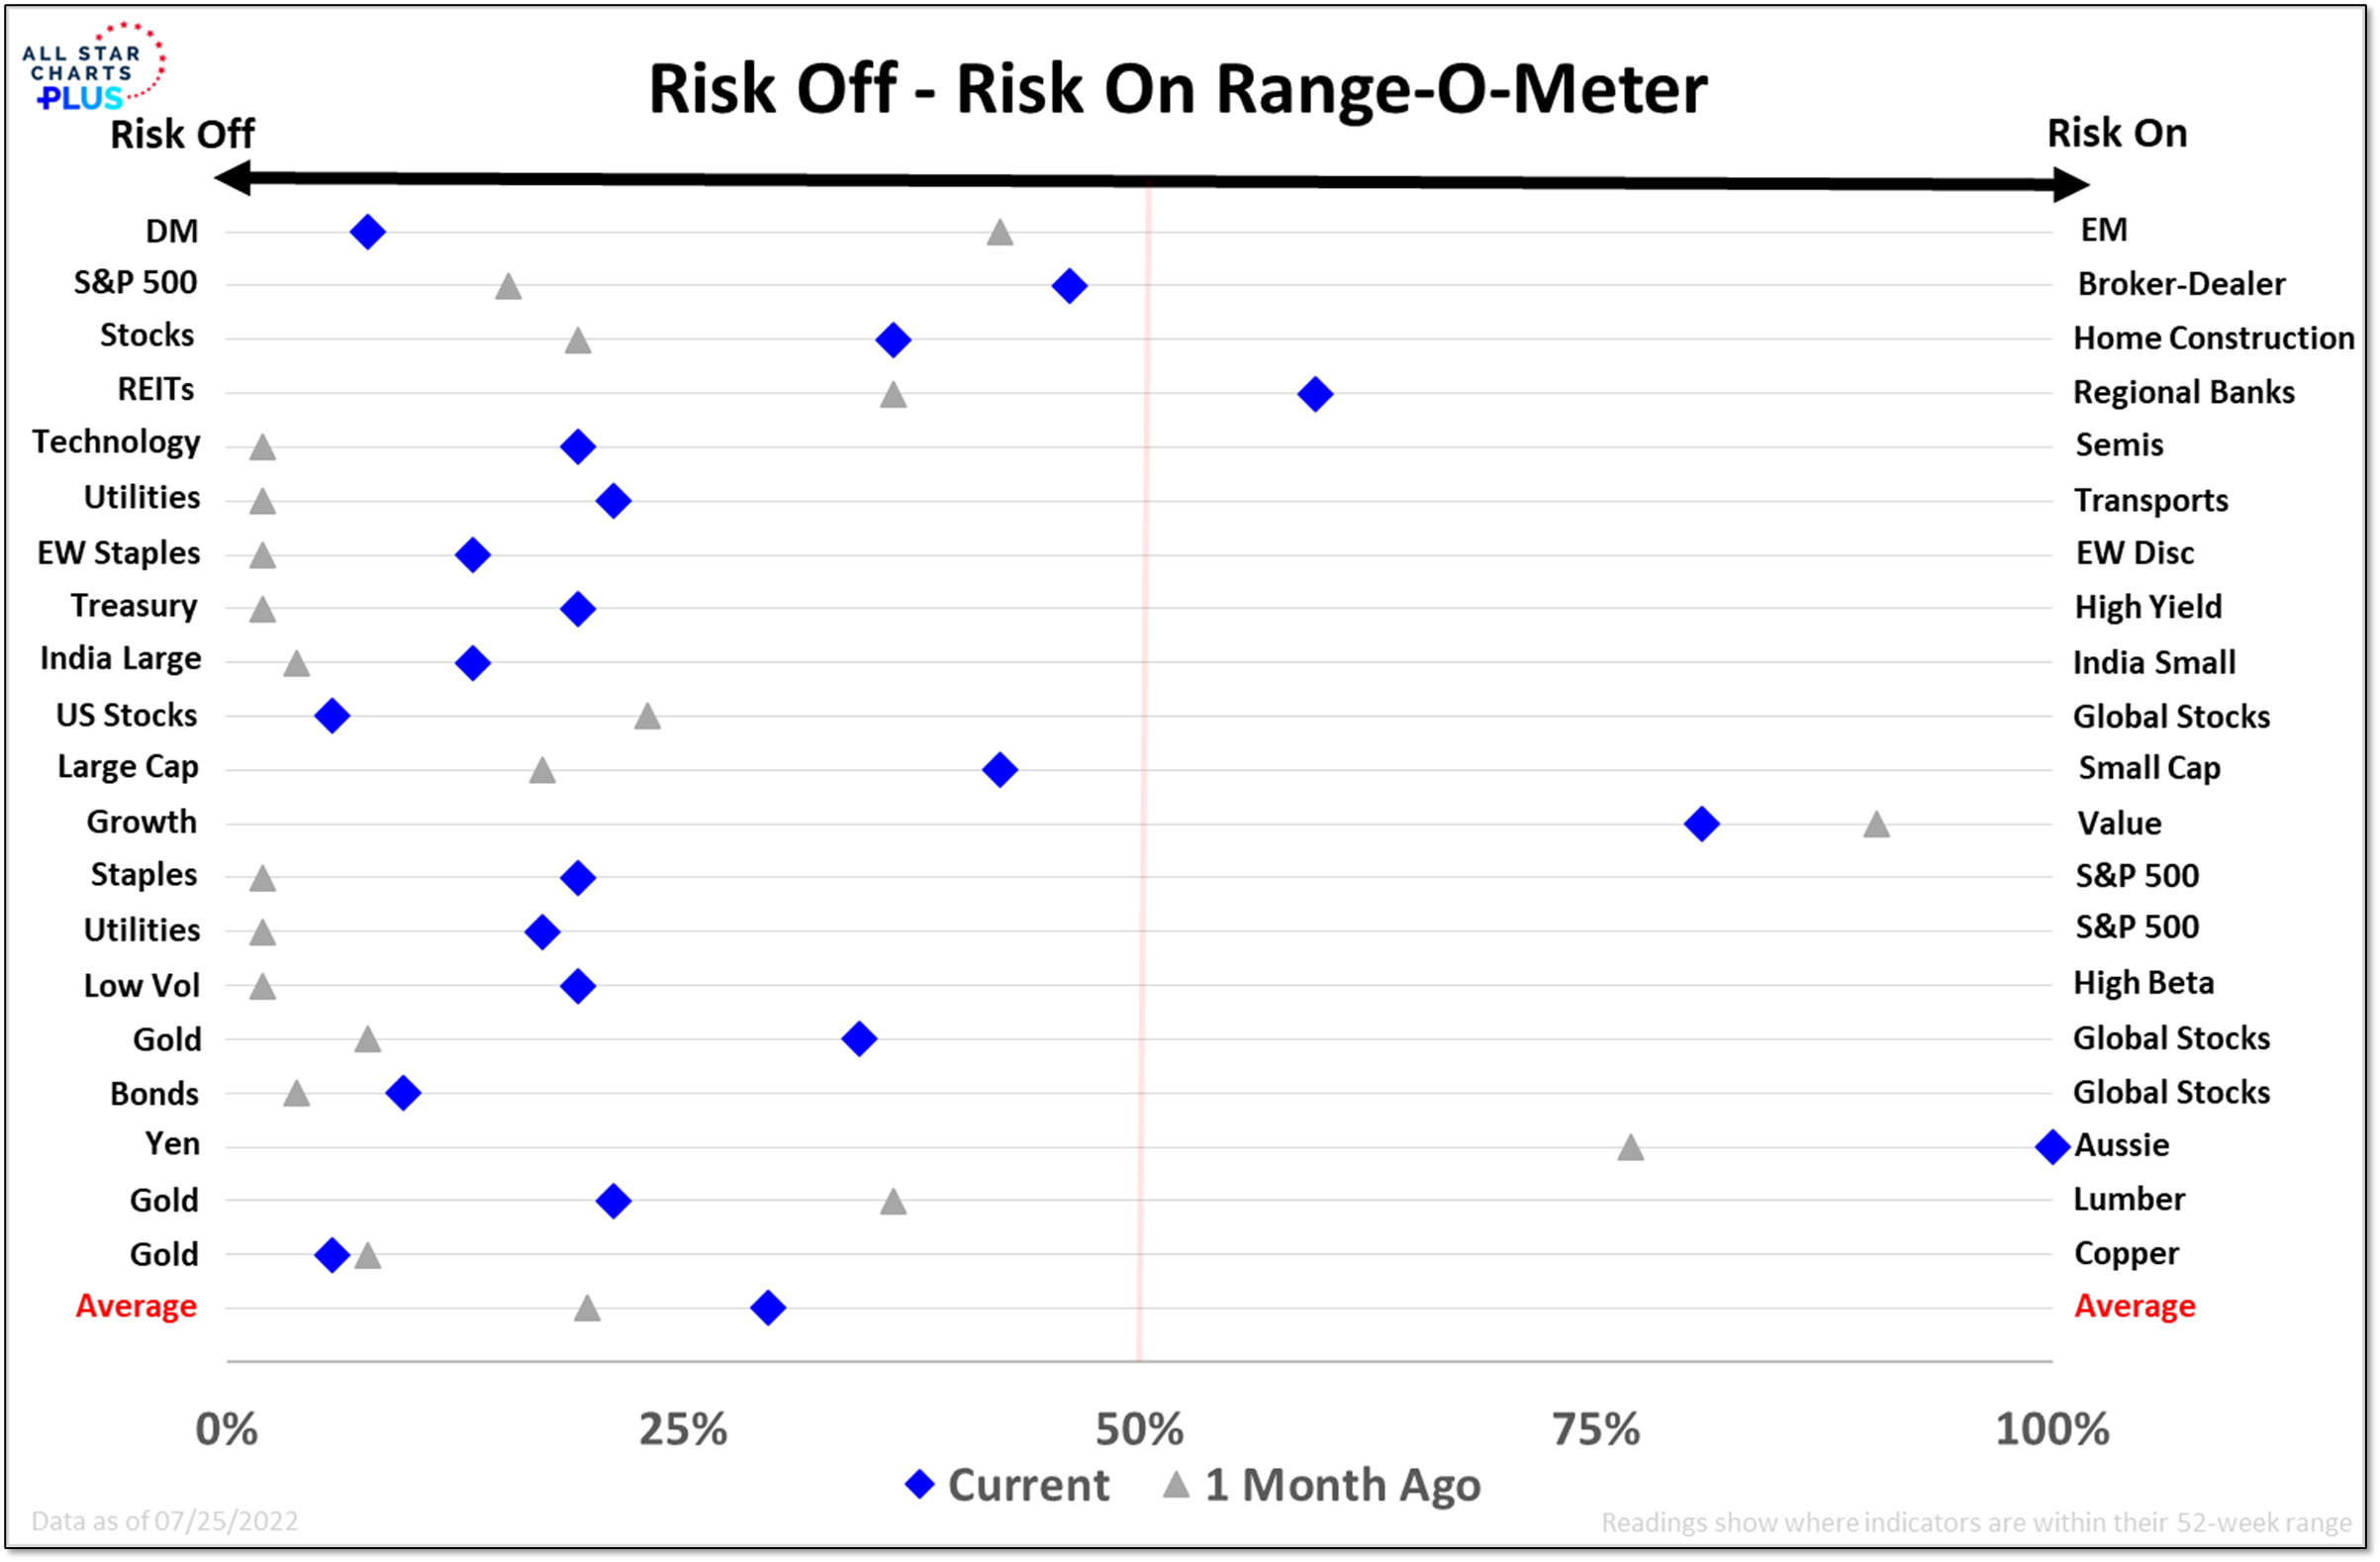
Before we get to that, even in the wake of the recent thrusts there is room for further improvement from a market perspective. The turn higher in new highs versus new lows remains tenuous and a robust appetite for risk has been elusive. This Risk Off – Risk On Range-O-Meter compares where the ratios between the various risk pairs currently trade – relative to their 52-week range (blue diamonds) and relative to their 13-week range (gray triangles). For 18 of the 20 pairs, the ratios are closer to their Risk On extreme on a 13-week basis than on a 52-week basis. This points to an improving risk appetite. But over both their 52-week range and 13-week range, a majority remain closer to their Risk Off extreme than Risk On extreme. That is not evidence of Risk On leadership and strength.
[PLUS] Weekly Market Perspectives – Breadth Thrust! Now What?
Key Takeaways:
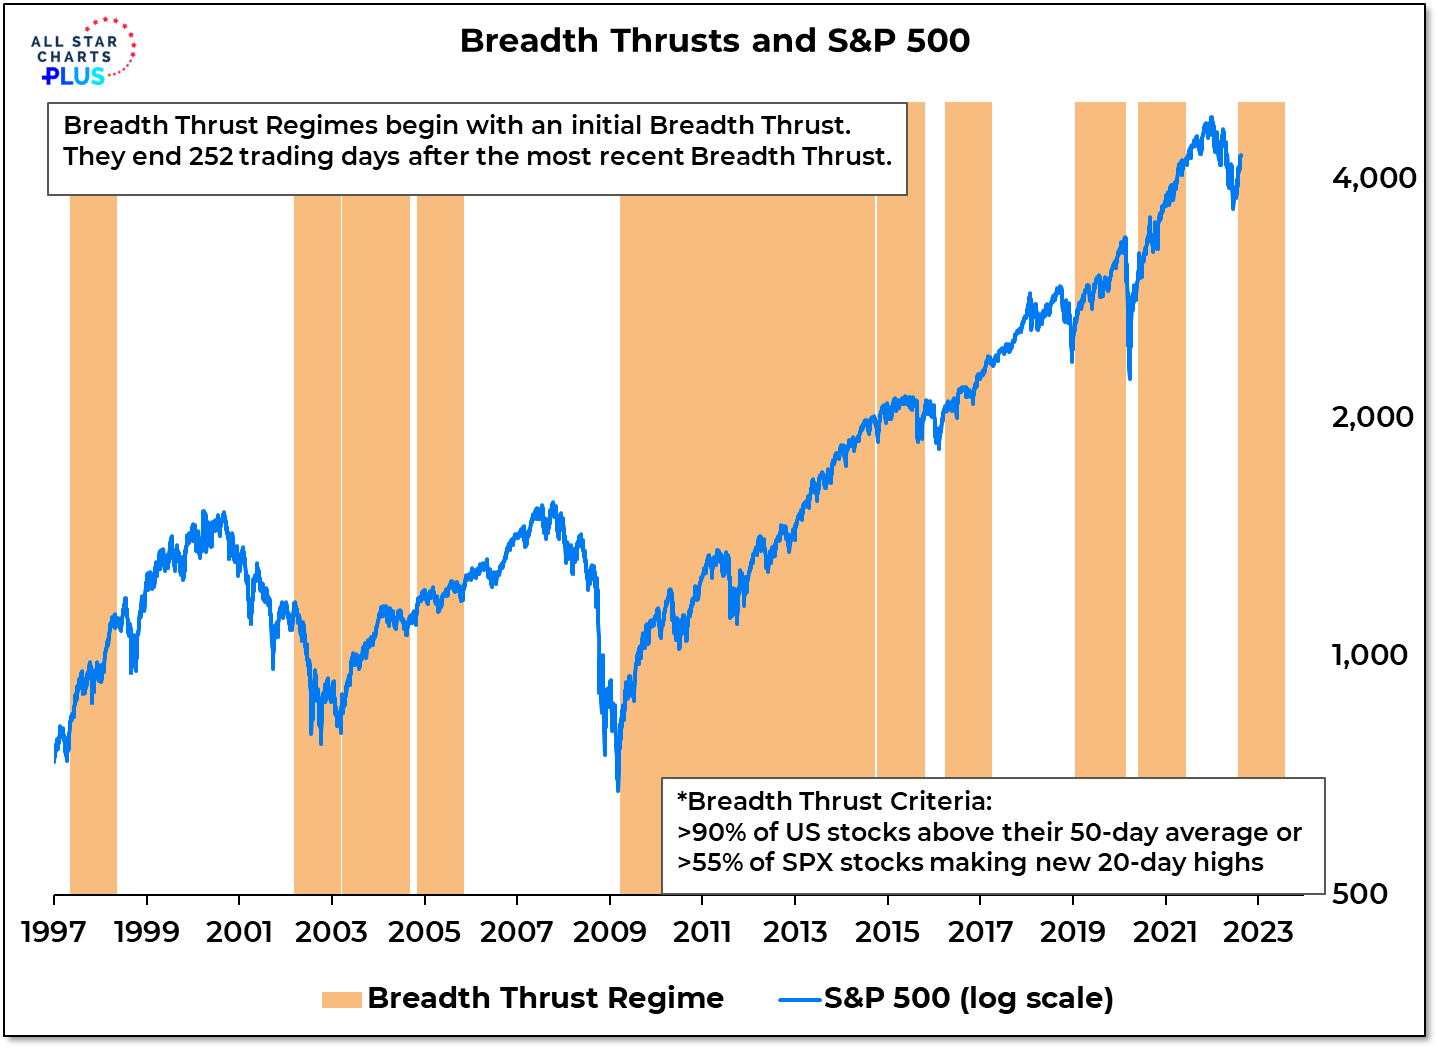
- Breadth thrusts and global strength have fueled the market in the past
- Price patterns are consistent but participation is stronger now than in 2008
- If June low was important, remainder of 2022 could see less volatility and more strength
The first half of 2022 was a great time to be on the sidelines, letting the bulls and bears bloody themselves in the market. Last year saw the previous breadth thrust regime expire in June and by November more stocks were making new lows than new highs. As 2021 turned to 2022, fewer and fewer world markets were showing any strength. The second half of the year is shaping up to be a different story, with a breadth thrust in July and a sharp expansion in the percentage of world markets trading above their 50-day averages, the conditions that have fueled all of the net gains in the S&P 500 in the past 40+ years are now present.
We have compared the market action over the first half of 2022 to the behavior of the market following the peak in Q4 2007. While the price action has been eerily similar, the breadth thrust in July makes continuing along this path a less likely outcome. This isn’t discounting macro concerns as much as it is trusting the evidence that we have in hand. As significant as some of the rallies were in 2008, none were able to produce a breadth thrust. Seeing less volatility in the indexes and more strength beneath the surface over the remainder of the year would be further evidence that the June lows marked an important turning point.
[PLUS] Weekly Market Perspectives – Burden Of Proof Is On The Bulls
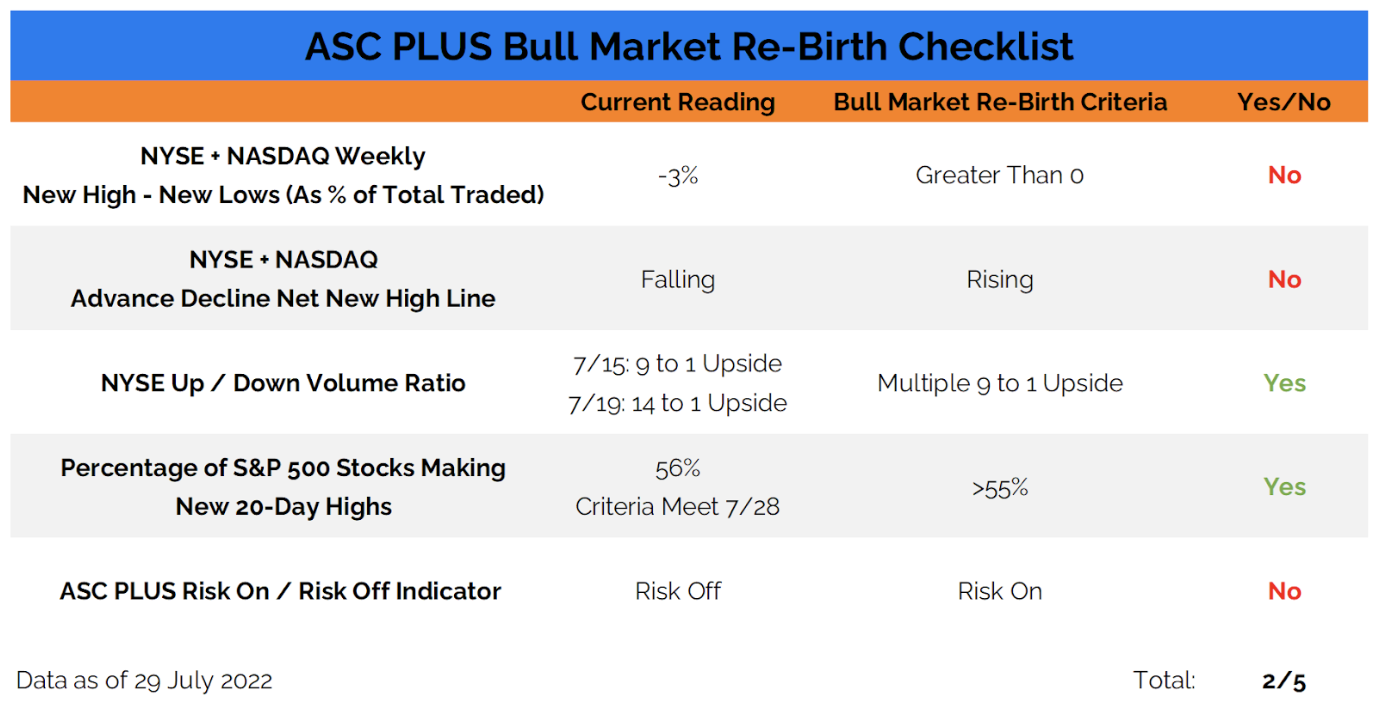
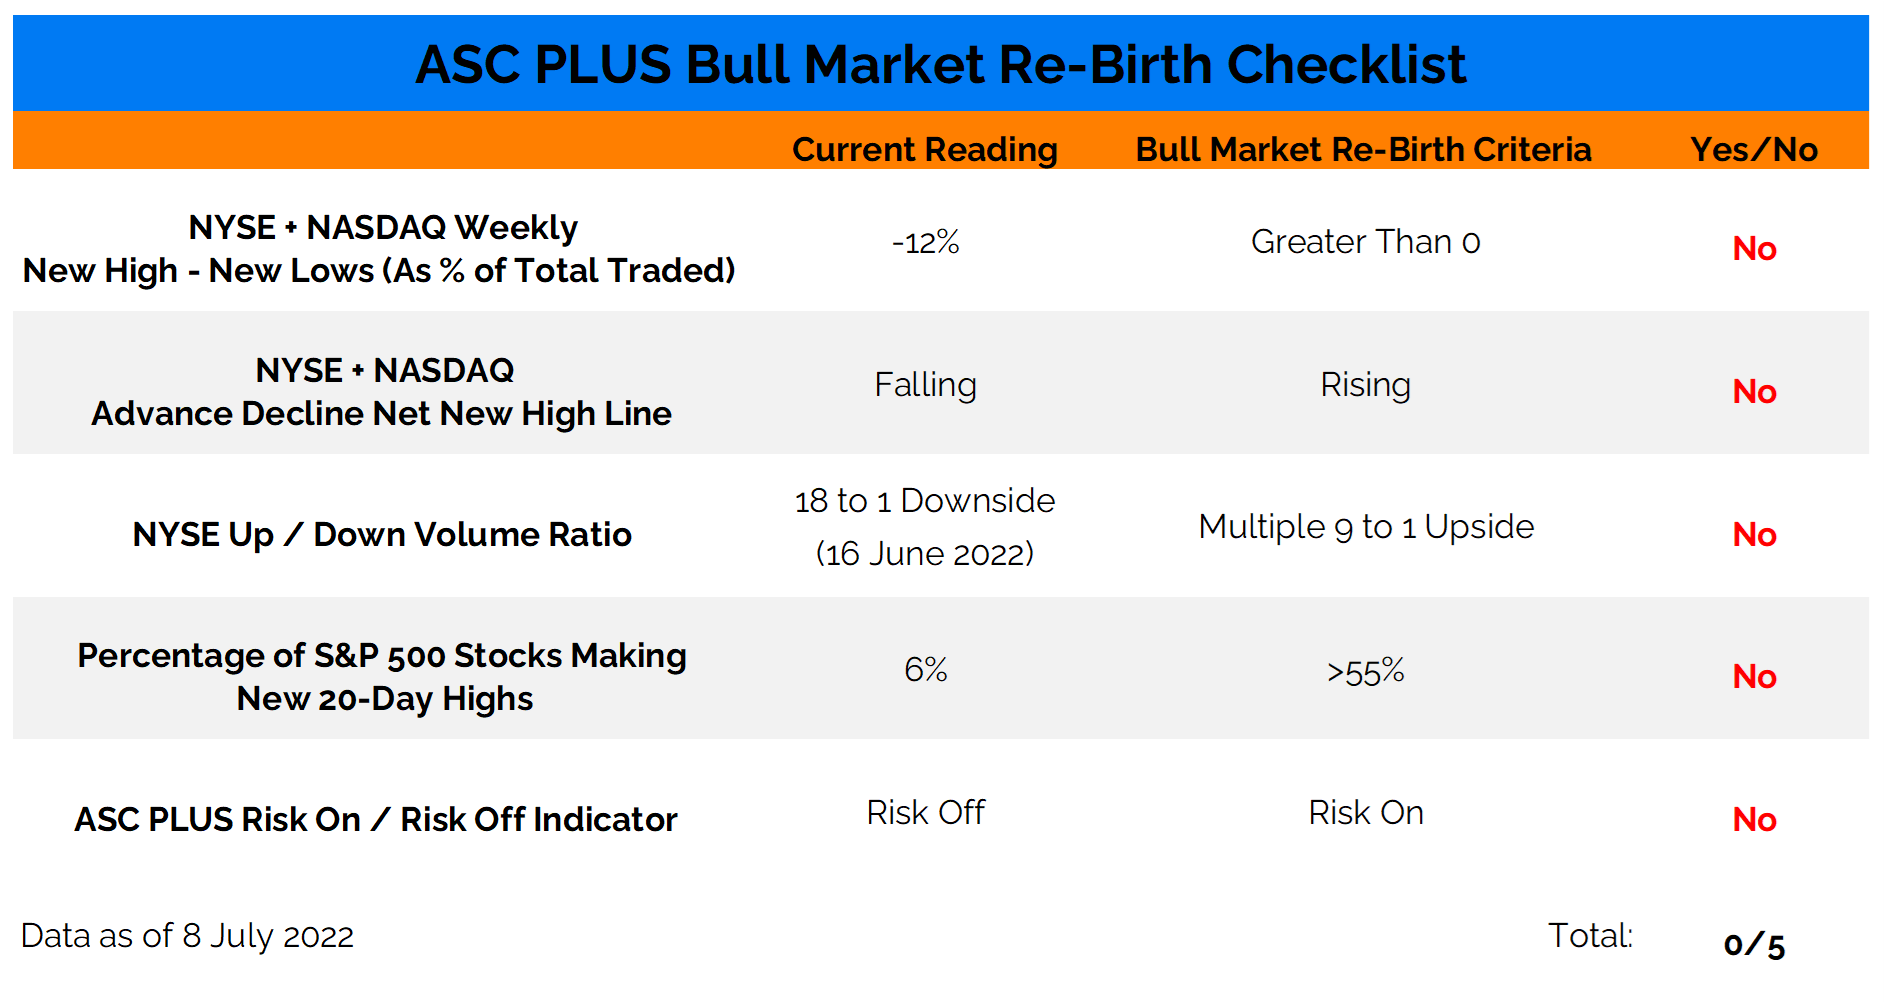
We are still waiting for evidence that the bear market in equities has run its course, and a new bull market is being reborn. We have seen the short-term risk environment improve slightly over the last few weeks (2/5 criteria triggered), and the overall environment is beginning to lean more toward opportunity than risk. However, the burden of proof is on the bulls to show evidence of a sustainable move higher.
[PLUS] Weekly Market Perspectives – Risk Indicators Remain On Defense
It’s been over a month since the S&P 500 made a new year-to-date low and market volatility has cooled somewhat. After averaging a 1% move (in either direction) every other day in the first half of the year, the S&P 500 has only had 5 such moves so far in July (16 trading days). The last one was over a week ago.
A couple 9-to-1 up volume days on the NYSE and an uptick in bulls on the sentiment surveys is providing some hope that the bear market environment may be fading. Our Risk Indicators (as well as the continued presence of more stocks making new lows than new highs) argue that it is premature to jump to that conclusion.
We have seen some improvement over the past month, and of the 20 risk off – risk on asset pairs, 14 are closer to their risk-on extreme than they were a month ago. But even with that improvement, only 3 of the pairs are closer to the risk-extreme than the risk-off extreme. In this fight over field position team “Risk Off” is winning. As we get into the details, this story is more about a lack of risk appetite and risk on weakness rather than broad strength out of risk off components.
[PLUS] Weekly Macro Perspectives – Economy Still Reckoning With Pre-COVID Imbalances
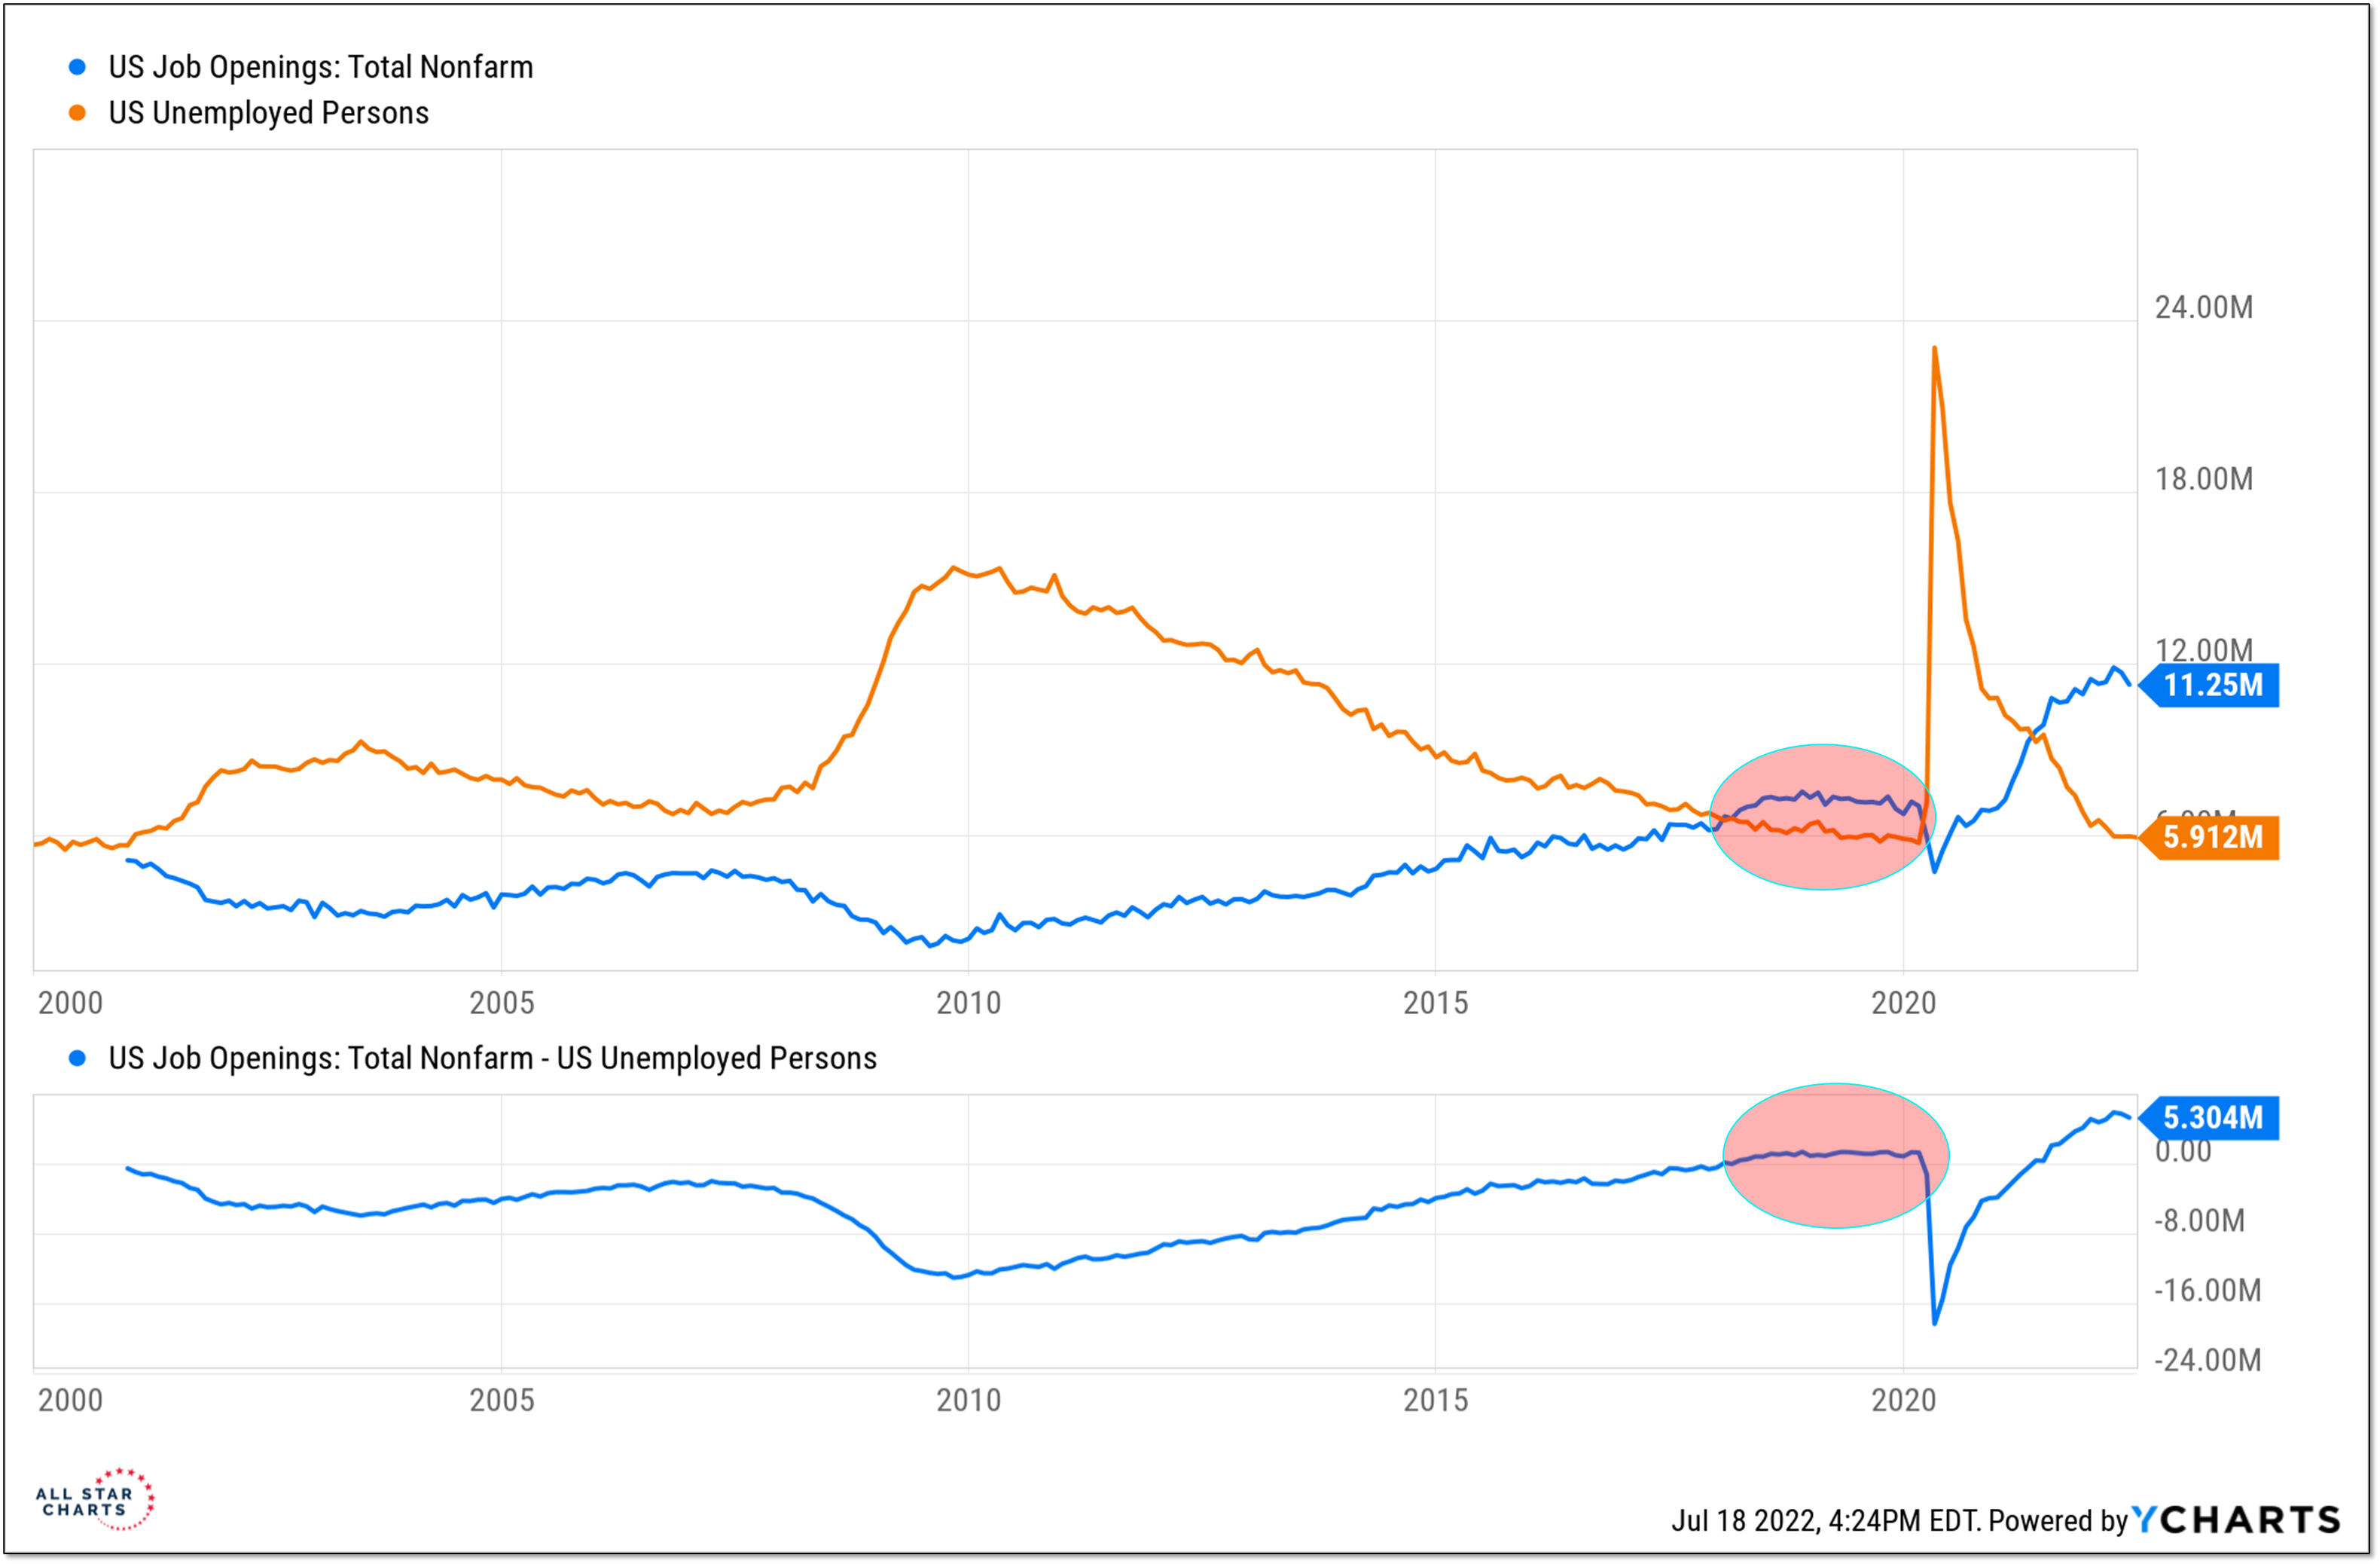
The current imbalance between job openings and unemployed persons gets plenty of attention. That there are twice as many job openings as there are people looking for a job is a historically unique situation. Having more job openings than job searchers, however, is not unprecedented. That was also the situation in 2018 and 2019, though the emergence of COVID seems to have washed that from our collective awareness. I can still clearly recall discussing skilled worker shortages with small business owners in the Midwest. The policy responses (both fiscal and monetary) to COVID exacerbated these imbalances, but the seeds of the current wage and price pressures were being sown before lockdowns and social distancing became a reality.
This suggests a more deeply embedded issue for the economy in terms of reducing wage and price pressure than many (even those at the Fed) appreciate. The relative scarcity of workers may also mean that employers will be less likely to reduce headcount in the face of economic headwinds than they have in the recent past. Looking at average weekly hours and aggregate hours worked indexes may be more useful than watching payroll data.
[PLUS] Weekly Market Perspectives – Bull Market Rebirth Checklist Remains Shutout
I’m away for a few days enjoying Wisconsin’s Door County Peninsula. It’s been great to camp and explore in what is widely known as “the Cape Cod of the Midwest.”
I’ll be back Thursday for our regularly scheduled Town Hall but in the mean time, here’s a quick look at our latest Bull Market Re-Birth Checklist.
- « Previous Page
- 1
- 2
- 3
- 4
- 5
- …
- 9
- Next Page »