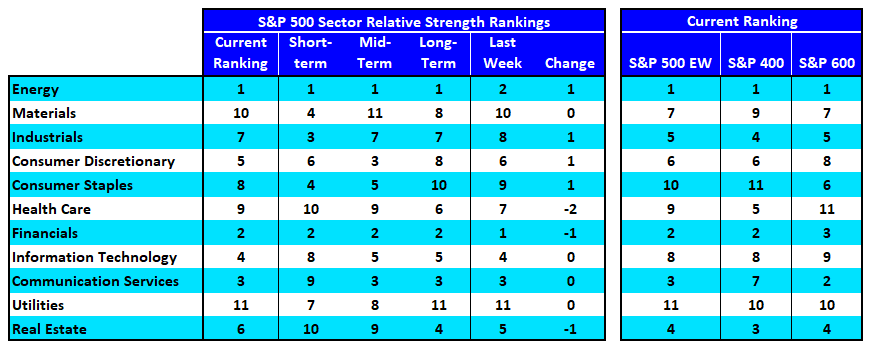
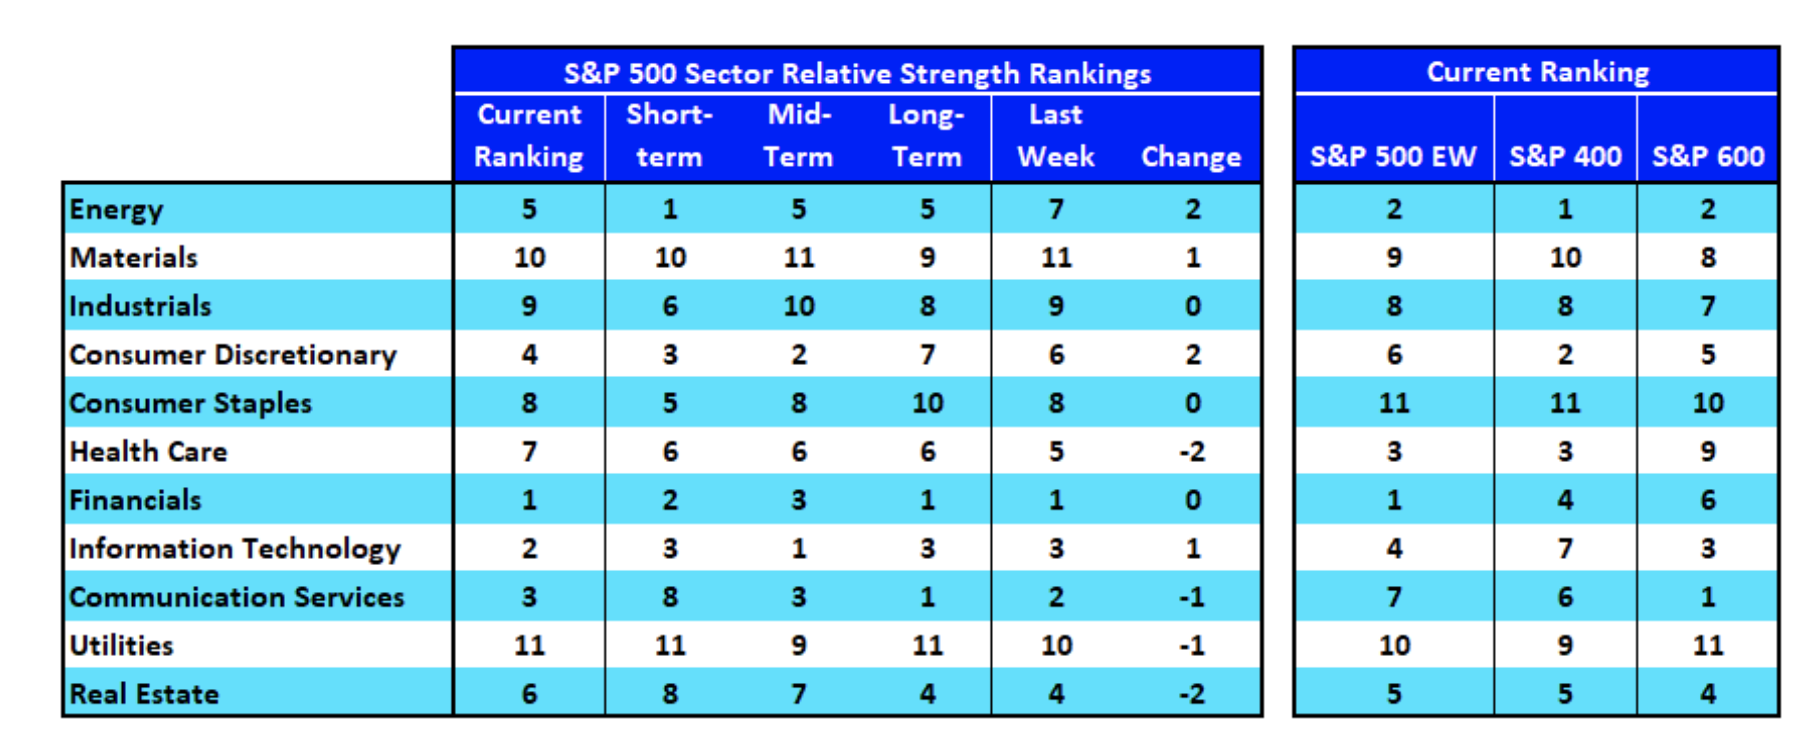
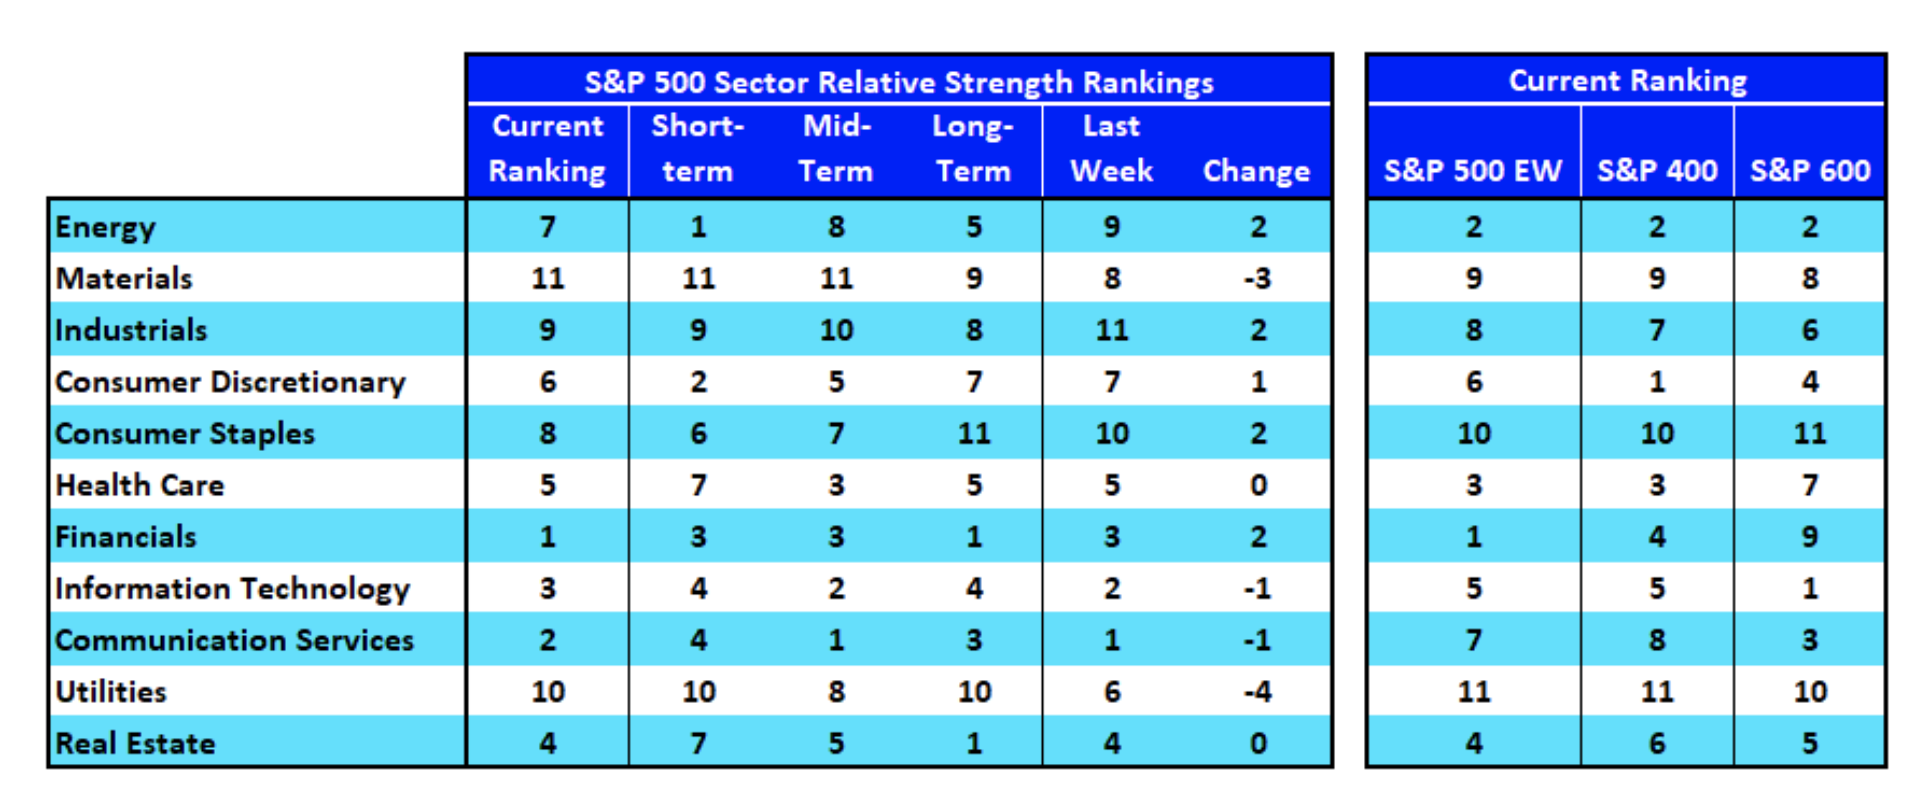
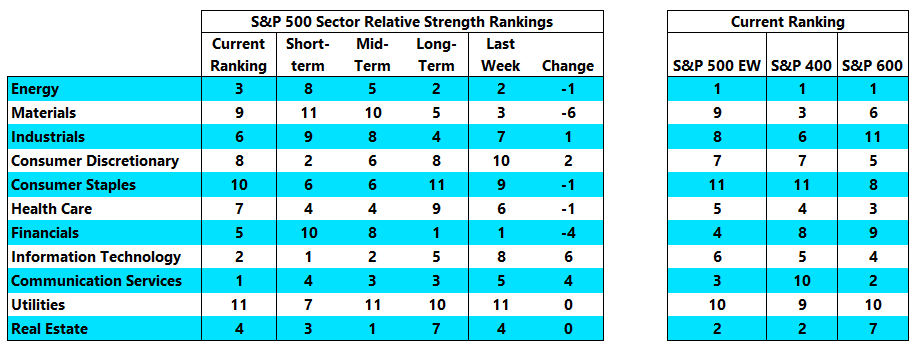
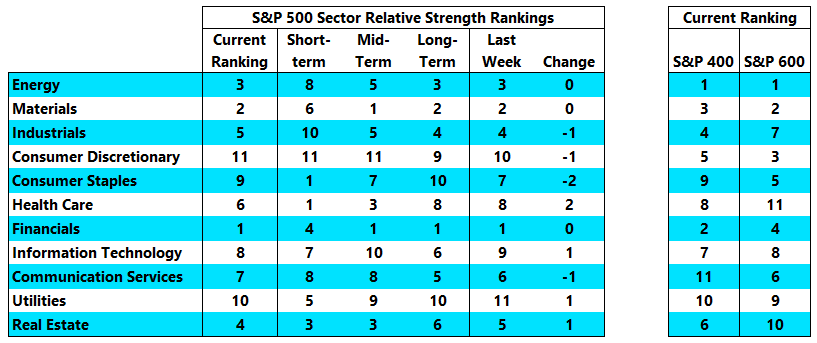
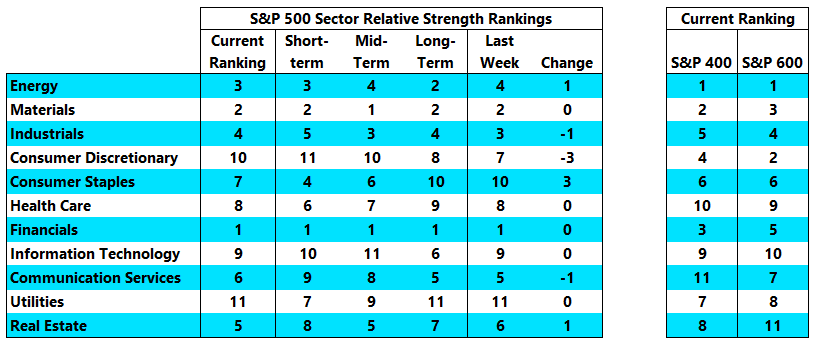
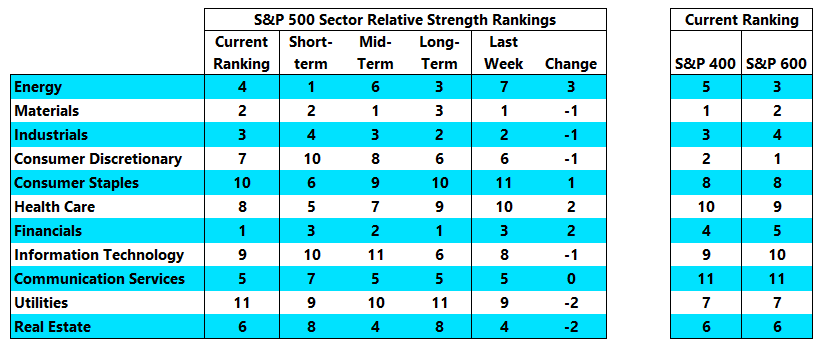
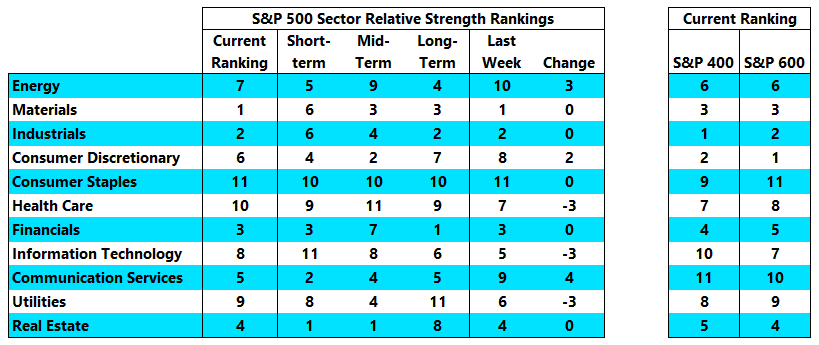
- Energy and Financials switched spots this week but remain at the top of the relative strength rankings, with leadership evident across time frames and market cap levels. Over the past three months, no other sector is up more than 1%. The Financials sector is up 6% and Energy is up 8%.
- Our industry group heat map shows notable strength in Energy and Banks. Health Care, Technology and Telecom groups are coming under pressure.
[PLUS] Weekly Market Notes & Breadth Trends
- Energy, which was near the bottom of the rankings from both a cap-weight and equal-weight basis as September began, has continued to gain strength. It has been the top performing sector on a short-term basis (as well as on a YTD basis) and has climbed into the middle of the overall rankings and is at number 2 on an equal-weight basis.
- Health Care and Real Estate have dropped in the rankings, though the industry group heat map shows there remain pockets of strength at the industry group level within the Health Care sector.
[PLUS] Weekly Market Notes & Breadth Trends
- Financials moved back into the top spot in this week’s rankings. It holds the top spot in the equal-weight version of the large-cap rankings as well, suggesting broad strength within the sector. Utilities & Materials saw big drops in the rankings and relative weakness in those sectors is present across various capitalization levels.
- Sector-level weakness in Utilities is confirmed in our industry group heatmap. Other areas of broad deterioration include Capital Goods, Tech Hardware, and Real Estate.
[PLUS] Weekly Market Notes & Breadth Trends
From the desk of Willie Delwiche.
- Last week’s volatility produced a shake-up in our relative strength rankings. Materials and Financials both saw big drops, while Technology and Communication Services surged into the lead.
- Looking beyond the cap-weighted S&P 500 sectors shows a less decisive shift in leadership – Energy & Real Estate remain strong, both at the sector level and in terms of the industry group heat map.
[PLUS] Weekly Market Notes & Breadth Trends
From the desk of Willie Delwiche.
Key Takeaway: Mixed liquidity backdrop makes rebuilding risk appetites more of a challenge. Tailwinds that have fueled cyclical strength are tapering even if the Fed is not yet ready to. Breadth on a slippery slope from digestion to deterioration to downtrend.
While the indexes themselves continue to hold up relatively well, there is evidence of deterioration that cannot be overlooked from a tactical perspective. Whether this builds into a situation that argues for more defensive positioning from a cyclical perspective remains to be seen.
Our relative strength leadership group was unchanged last week. Financials, Materials, and Energy are the leaders at the large-cap level and are also holding up well at the mid-cap and small-cap level. Our industry group heat map reflects these leadership trends. There is little evidence here that cyclical value leadership is waning in favor of resurgent cyclical growth. Defensive sectors have fared better on a short-term basis but that has yet to result in a sustained climb in our relative strength rankings.
[PLUS] Weekly Market Notes & Breadth Trends
From the desk of Willie Delwiche.
Key Takeaway: Investors finding themselves with too much Technology exposure. Speculative unwind occurring as neglected areas of the market make new highs. Inflation concerns are overdone in the near term but represent a new reality for the coming decade.
Cyclical value sectors remain atop the relative strength rankings, with Financials and Materials (both of which made new highs last week even as the S&P 500 overall lost ground) holding on to the top two spots. The big gainer in this week’s rankings is Consumer Staples, which climbed three spots in the relative strength rankings. Staples also finished the week at a new high. The industry group heat map shows improving conditions widespread among large-cap groups and deteriorating conditions widespread among small-cap groups. Actual leadership is pretty consistent across sizes and is consistent with the sector rankings.
[PLUS] Weekly Market Notes & Breadth Trends
From the desk of Willie Delwiche.
Key Takeaway: Stocks looking at a year two market. Stocks looking at a year of two markets. Economic surprises remain a tailwind for now but data struggling to keep up with expectations.
Cyclical value sectors remain in their leadership positions. New highs last week in Materials, Industrials & Financials helped pace the market, and rally participation with these sectors remains robust. The rotation out of leadership from the growth sectors can make it a challenging environment for passive investors. Technology, Discretionary, and Communication Services make up 50% of the market cap of the S&P 500, and the index could struggle to see sustained strength if these areas are not participating. Defensive areas like Utilities & Consumer Staples are buried at the bottom of the rankings.
[PLUS] Weekly Market Notes & Breadth Trends
From the desk of Willie Delwiche.
Key Takeaway: New monthly highs reflect broad participation and a healthy rally. Stocks struggle to celebrate blowout quarters if future growth prospects are not bright. Elevated expectations bar could leave stocks & the economy victims of their own success.
Sector-level leadership is unchanged in this week’s relative strength rankings. Materials, Industrials, Financials and Real Estate held down the top four spots for the second week in a row. Choppiness and rotation continue outside of that group. Rotation can also be seen in our industry group heat map. Improving conditions are widespread at the large-cap level and deteriorating conditions are widespread at the small-cap level (see page 5 for a chart version of this rotation). Mid-cap groups dominate the top of our industry group rankings (holding seven of the top ten spots).
- « Previous Page
- 1
- …
- 5
- 6
- 7
- 8
- Next Page »