We talk a lot about the S&P500 and Dow Jones Industrial Average. Lately it’s been the Nasdaq100 leading the charge and actually the only index that hit new highs this month. Each of these are popular due to their large-cap components. In other words, these indexes consist of some of the biggest companies in America and most are household names like Apple or Microsoft, Exxon Mobil and McDonalds. These indexes are either cap-weighted, where the largest companies represent the largest percentage of the index or price-weighted, as in the Dow Industrials, where the highest priced stocks represent the largest holdings in the index. Today I want to focus on a broader equally-weighted index to get a better idea of what the market as a whole looks like. [Read more…]
We Don’t Live In An Average World
Guys, let’s just get something straight: we do not live in an average world. We never have lived in an average world. We most likely will never live in an average world. That’s just math, or science, or both I don’t know. But it is a fact. Think about how funny it is to hear someone say, “Well, on average XYZ goes up 2% after earnings”. Really? What the hell does that have to do with anything? So you mean a few times it lost over 10% overnight, a few times it rallied over 10% overnight, sometimes it fell somewhere in between…..so “on average” it goes up 2%? Are you kidding me? Are we trying to make money and manage risk or fill airtime with irrelevant facts so we can sell more ads? [Read more…]
Flat 200 Day Moving Averages Create Headaches
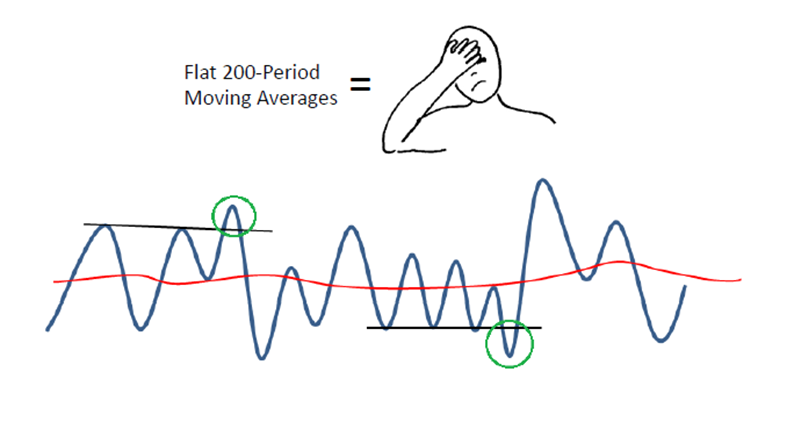
Today I want to bring up something that I discuss often, but I’m not sure that I ever explained clearly in a blog post. Long-time readers know that I only use a handful of tools as a supplement to price action. I want to reiterate “supplement”, because price is the most important indicator we have, it’s the only one that we can actually trust, and the rest are there simply to add confirmation or help dissuade us away from our thesis.
The 200 day moving average is one that is mentioned a ton throughout the financial media and twitterspheres of the world, but is often misinterpreted for whatever the reason. Usually the 200 day is referring to [Read more…]
An Open Letter About Today’s Market Environment
November 18, 2015
Dear Readers,
We are just about 6 weeks away from finishing up 2015 and as usual there are a lot of questions left unanswered. Now is as good of a time as any to look back at how we got here so we can take a weight-of-the-evidence approach and put together a thesis of what we should expect going forward. At AllStarCharts, we prefer to incorporate a global top/down approach focusing our attention on various liquid asset classes with exposure both domestically and outside of the United States. With our long/short mentality, we look for opportunities to profit from both good and bad markets striving for absolute returns regardless of the economic environment.
Today we’ll start with the U.S. Stock Market which is relatively flat year-to-date. In large-caps, the S&P500 and Dow Jones Industrial Average have gone nowhere this year, while the leader has been the Nasdaq100 (up 10% YTD) and the laggard is obviously the Dow Jones Transportation Average (down over 10% YTD). With the tremendous amount of dislocation between Transports and the Tech-heavy Nasdaq, we’ll call that a wash and chalk this year up as flat, at least for now. The problem is, that the indexes don’t tell the whole story. Even before the August sell-off, the amount of stocks still making new highs was an embarrassment as only a small percentage of them were still rallying. The Consumer Discretionary space and the Dow Jones Internet Index were two standouts without much company. Looking at things today, and over the past few weeks, even fewer names are participating. The Nasdaq100 was the only index to make new highs this month as the rest rolled over putting in lower highs across the board.
The word “Distribution” really explains what is going on here in the U.S. Stock market. We can see a massive topping pattern forming in the S&P500 right at the 161.8% extension of the entire 2007-2009 decline. We don’t look at this as a coincidence. This distribution is also taking place at exactly the March 2000 highs for both the Nasdaq Composite and the Nasdaq100. Again, not something we consider to be a coincidence. The question we want to ask going forward is simple: with very few sectors and stocks in the market left participating to the upside, is this the tell before a much bigger sell-off, or will certain sectors take leadership and carry this market higher going forward? In the S&P500 alone, almost 70% of stocks have corrected over 10% and close to 40% of them have fallen over 20%. Will this “market of stocks” collectively stabilize, rotate leadership and head higher? I would argue that no, this is definitely the lower probability outcome and in all likelihood we are heading much lower. From a risk vs reward standpoint, this still very much favors the bears. My levels are 114.40 for $QQQ AND 2080 for the S&P500. We only want to be short these averages if prices are below them and neutral if we are above.
Within the U.S. stock market, since we have a negative bias, we want to focus our attention on the laggards. With the Dow Jones Transportation Average easily the worst of the bunch, I think Airlines are the ones we want to short. Looking specifically at the Amex Airlines Index, we are seeing the exact opposite of what we saw in March 2009. If you recall, while the market as a group was putting in lower lows in the first quarter of 2009, the Airlines held in showing the relative strength at the time to spark a 330% rally, which by far and away outperformed the S&P500 and other indexes. Today, it is the relative weakness that is standing out as this index has been making lower lows all year in an environment where the other indexes continued higher into the Summer. The uptrend line from the 2009 lows in the Amex Airlines Index has now been broken and over the past few weeks have successfully retested it and rolled over. Momentum is in a strong bearish range and prices are trending below a downward sloping 200 day moving average. Bad things tend to happen in this type of environment. We want to be aggressively short a basket of these airlines as long as prices remain below the broken uptrend line from the 2009 lows. I would be adding to shorts if we break the lows from this week. Also see the ETF $JETS.
Looking more globally, it is hard to ignore the underperformance out of the New York Stock Exchange Composite. Although considered a local exchange, half of the biggest 100 names in this cap-weighted composite are foreign companies. The relative weakness here is further evidence that the U.S. is still the leader compared with the majority of the international stocks markets. The emerging space is particularly weak as the S&P500 is sitting at or near 11-year highs relative to the MSCI Emerging Markets Index. In the more developed countries, the Japanese Nikkei has held in relatively well compared to the U.S., but is currently in no-man’s land at best. Whether looking at the Nikkei specifically, or the Hedged Japan ETF $DXJ, which we like to use, with prices trading near flat long-term smoothing mechanisms, this is a headache waiting to happen and we want to stay away from it. I would put Germany in a similar neutral category, but leaning on the bearish side on both as we are below broken support which is new overhead supply in the Nikkei and the DAX.
On the long side of the International markets, I think the potential for further mean reversion in Latin America is certainly there, but it’s the probability, or lack thereof, that annoys me. We are focused on the Latin America 40 Index ETF $ILF and specifically within that group, the MSCI Brazil Index ETF $EWZ. Coincidentally, it would take breakouts above $25 in each of these to get me bullish and long for that mean reversion towards 28. But that’s all I’m seeing there.
Crude Oil is likely to have an impact in this space. I’ve been in the camp that Oil has bottomed out, although tactically I see little reason to be long from current levels. I’d like to see more backing and filling to create a base large enough to get this one going. Looking at this from a more structural perspective, the high 30s-low 40s was where Crude Oil prices would peak throughout the 1980s and 90s. Once that range broke out to the upside after the turn of the century, we expect this to be an area where prices bottom out instead. So I think we’re close. We are watching Heating Oil and Unleaded Gasoline futures as the tell. If prices can get and hold above the lows from throughout 2015, which are awfully close, I think that Oil can bottom out. If we start to see new lows holding in these other energy commodities, I think we’re in a lot of trouble in Crude Oil and anything with a positive correlation to the commodity.
Where I would prefer to focus my attention instead within energy is Natural Gas. In September of 2009, Natural Gas bottomed out at $1.92 before rallying above $7 over the next few months. In April 2012 the bottom was $1.83 before rallying over the next 2 years above $7 again. Last month Natural Gas hit $1.94 before reversing higher. This is one we want to own for a 20% rally here back towards $3. This is a tactical trade where for risk management purposes, nimble traders can use 2.40 as the line in the sand. Contracts roll next week, so adjust accordingly ($2.55 in Jan Futures). According to the CFTC, Commercial Hedgers, who we consider “the smart money”, currently have one of their largest long positions of all time. Bigger picture, the Crude Oil:Natural Gas ratio continues to fall. This bubble peaked at over 50:1 in early 2012 and the mean reversion back to the single digits is running its course. Today the ratio sits around 18:1, from a high of over 50:1 with a long-term average near 10:1. Also remember that we are in a reversion beyond the mean business, and not just a reversion to the mean. So an overshoot into the single digits in the ratio is most likely.
Moving over to the precious metals space, it’s hard to find a more beautiful downtrend out there in the world. With prices hitting new 5-year lows this week, sentiment is nowhere near as pessimistic as it has been at prior temporary lows in 2013 and 2014. I think this bullish (less bearish) outlook from the public will be the catalyst to take Gold under $1000 and Silver under $12. The risk/reward today is not as clean as it once was a few weeks back, but the trend here is lower and we want to continue to fade any strength in metals.
The U.S. Dollar should have an impact in this group as it has consolidated its gains from the past few years in one of the healthiest consolidations across the global marketplace. Back in March, we saw the most bullish sentiment towards the Dollar in history. The Commercial Hedgers were selling this thing like if it was going to zero. Anecdotally, the financial media who has never cared what I thought about the U.S. Dollar could not finish a phone call or email with me without asking my thoughts on the Dollar. Since then, however, the sentiment has dissipated and the hedgers have covered a lot of their bearish positions. It’s hard not to like the Dollar here. I think it continues to head higher after the recent breakout. This should have negative implications towards the Euro, which represents close to 60% of the U.S. Dollar Index. I would expect the Euro to continue to fall along with precious metals as we head into the first quarter of next year.
Next we turn to the Bond market. The collective waste of time of arguing about fed hikes or not continues to dominate the airwaves and interwebs. We try and ignore what the Fed has to say as much as we can and even more so Wall Street Economists. There is no group on planet earth that has been more wrong about anything as Wall Street Economists have been about the Fed. We prefer instead to focus on price, which at the end of the day is the only thing that will pay us. First of all, we are talking about a 35 year bear market for rates. Things don’t just turn on a dime. So to blindly short the bond market because “rates can’t go any lower” makes zero sense to us. Now, the short end of the curve and the long end are two different things. The 2-year US Treasury bond yield is highs this week not seen since 2010, but the 30-year yield hit fresh lows earlier this year and has not shown any signs of a major bottom. This dislocation has caused the yield curve to narrow. Note that an inversion of the yield curve (short-term rates exceeding long-term rates) is a heads up of a pending economic recession.
Since we don’t have time to sit around waiting for yield curve inversions, we prefer to focus on the here and now. Looking at the 10-year yield, widely considered the benchmark for U.S. Interest Rates, it’s the 2.4% level that stands out the most. This was the low in rates in 2010 and also twin highs in late 2011 and early 2012. We kissed that this month and quickly rolled over. Going forward, this is our line in the sand. As long as the 10-year is below 2.4%, we want to be buying U.S. Treasury Bonds very aggressively, particularly the 30-year Futures $ZB_F. Equity traders can turn to the iShares 20+ Year Treasury Bond ETF $TLT or $TLT options for non-futures exposure. We are not expecting any rate hikes in 2016 and regardless of any rumors, we want to be buying bonds here.
That’s it for now. Please feel free to write with any questions or comments that you may have.
JC
***
Note: In next week’s letter we will spend time looking at Biotechnology, Palladium, Agricultural commodities and equities and some individual U.S. stocks like Apple, Amazon and Netflix on both the long and the short side.
Tags: $SPY $QQQ $UNG $USO $CL_F $NG_F $GC_F $GLD $SI_F $SLV $UUP $DX_F $EURUSD $FXE $TNX $TLT $ZB_F $HO_F $RB_F $EWG $DAX $NIKK $DXJ $USDJPY $6J_F $FXY $ILF $EWZ $XAL $JETS
Why Airlines Are Ready For Another Leg Lower
The Transportation stocks are the big losers this year. With most of the major U.S. Averages flat for 2015 (except the Nasdaq100 up 10%) the Dow Jones Transportation Average is down over 10% year-to-date. The underperformance out of the space is telling and I believe there is more to come. Today we are focusing specifically on the Airline stocks, which I think are about to see another leg lower, likely over 20%. The risk here is also very well-defined, which for those of us who are here to make money (not noise), is all that actually matters.
Here is a longer-term chart of the Amex Airlines Index. The first thing that stands out is the uptrend from the March 2009 lows. This level marked an important bottom, not just in Airlines, but for the U.S. stock market as a whole. Notice how in the first quarter of 2009, the Airline Index did NOT make new lows below it’s Q4 2008 trough. This relative strength was the tell before such tremendous outperformance ever since. The Dow Transports rallied over 330% from those lows, crushing the returns of the other indexes. Today we are seeing the opposite as it breaks the uptrend line from those 2009 lows and struggling vs the other averages all year:
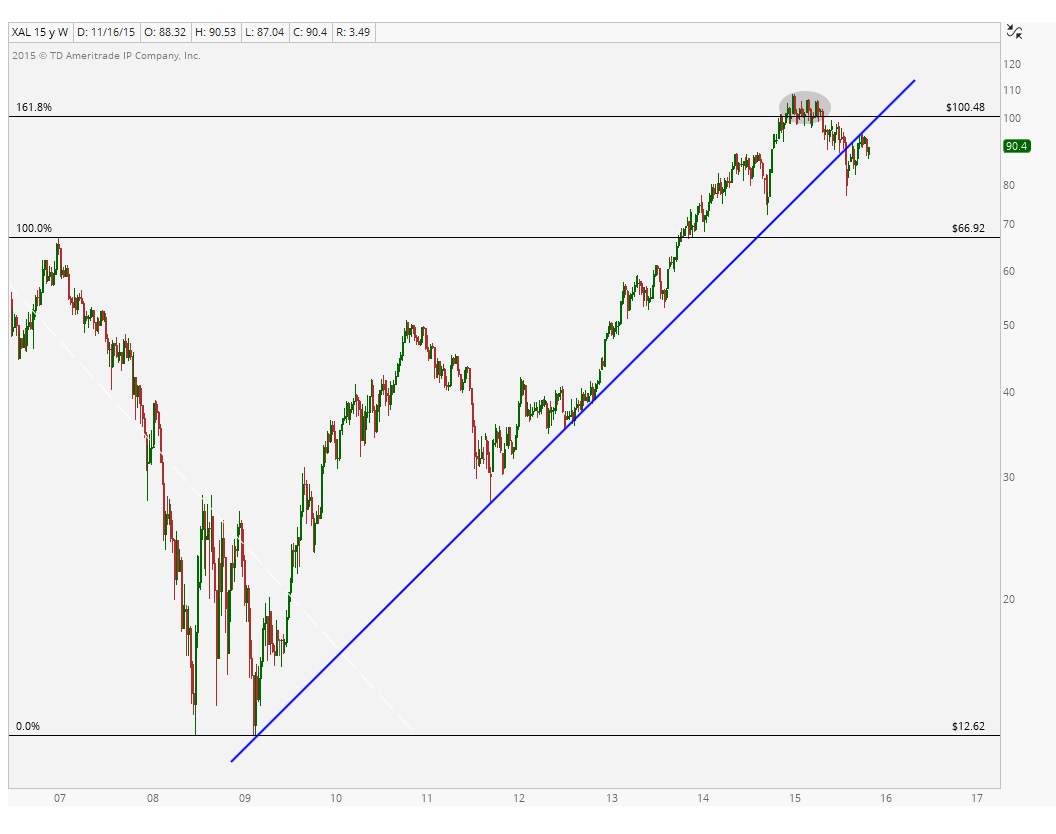
Also notice how prices reached the 161.8% extension of the 2007-2009 decline, hovered around that area, and then rolled over hard. This exhaustion is further evidence that more selling is likely coming soon.
Short-term, we can see prices below a downward sloping 200 day moving average. Bad things tend to happen when prices are trading below this downward sloping smoothing mechanism. Another issue is the overhead supply. Prices are holding below all of that former support near 98 from the first half of the year. All of that overhead supply is an issue, not to mention the downtrend line from the January highs. That is way too much trouble to get me long Airlines:
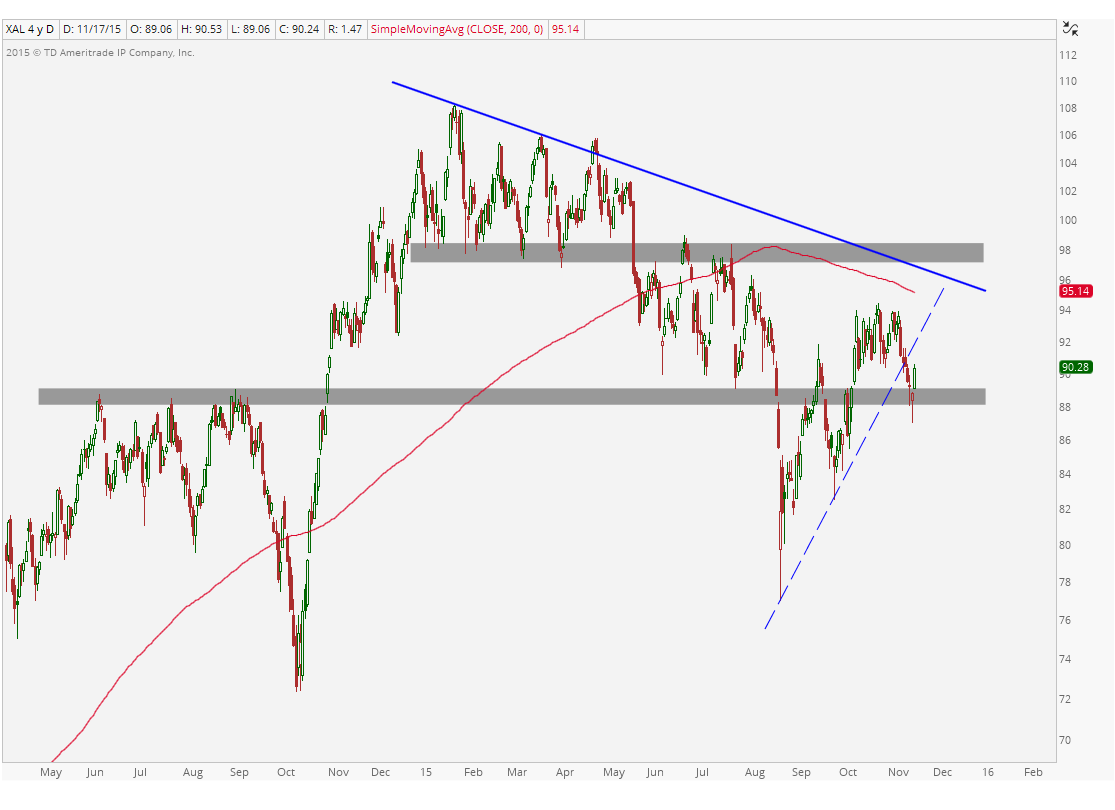
Now look at the uptrend line from the August lows. That’s now broken as well. When what is typically a continuation pattern instead resolves itself to the downside, the market is speaking. It’s up to us to listen. This is the case with that “bull flag” throughout the second half of October, that resolved lower. We take this as further evidence of overhead supply.
What can change my mind? We always want to make the counter-argument because the one thing that we do know is that none of us know what will happen. If the circumstances change, then we change our tune, simple as that. First of all, we need to see prices climb back above the broken uptrend line from the August lows. Then we need to consolidate those gains, allow the declining 200 day moving average to flatten out and begin to slope higher. Then we need to take out that broken support from the first half of the year near 98. In order to accomplish this difficult feat, it will take time. It’s not going to happen tomorrow and it will be a headache along the way. So to get long hoping for that outcome makes little sense to me. I would prefer to be wrong and let time ultimately get me long, if that eventually becomes the case.
On a more realistic note, we want to err on the short side of airlines. From an execution standpoint, we want to be short a basket of Airlines (also see: $JETS) if and only if prices of the Airline index are below the highs from the Summer of 2014. This is a big level for us which represents that former resistance, but also the broken uptrend line from the 2009 lows. A rollover below Monday’s reversal should trigger a massive sell-off. That to me is the highest probability outcome from where we sit today.
***
Click Here to receive updates on each of these charts every week including 30 other sectors and sub-sectors such as Energy, Financials, Gold Miners and Technology.

Tags: $XAL $DAL $AMR $AAL $ALK $AVH $CEA $ZNH $GOL $LFL $LUV $UAL $JETS
Is FANG This Cycle’s Four Horsemen?
I don’t know what’s going to happen tomorrow or next month or next year. No one does. But today I just want to keep it real and bring up an interesting development that is difficult for me to ignore. It’s no secret that the stock market currently has terrible breadth as only a handful of names were able to make new highs a couple of weeks ago and the only index to make a new high was the Tech-heavy large-cap Nasdaq100. The rest of them all put in lower highs (which is characteristic of a downtrend).
As the cliché goes, “This is a market of stocks, not a stock market”. But cliché or not, it’s true, and also under appreciated. When the market as a whole is making new highs, you want to see that being confirmed by a larger number of stocks and sectors also putting in new highs. The last thing you want to see is the opposite, as we are seeing today (and in the Fall of 2007 coincidentally?). If you recall, as the major averages were hitting new highs in October of 2007, only a few individual stocks were still hitting new highs. A popular group of those were being referred to as “The Four Horsemen” at the time as they were some of the only names still holding up. This group included, Google, Apple, Amazon and Research in Motion (Blackberry).
I remember this time very clearly as there was an ongoing joke at work that if you weren’t trading these 4 names, why bother even coming in? This is strictly anecdotal, of course, but an interesting coincidence that the media is constantly referencing a new group of stocks called “FANG”. The label for this group may not have been made up yesterday, but the frequency of mentions continues to grow. The FANG stocks include Facebook, Amazon, Netflix and Google. The question I pose today: Is FANG this cycle’s Four Horsemen?
I don’t know the answer and neither does anyone else reading this right now. But I find it very difficult to ignore the similarities between these two groups of stocks. Remember, like the 4 Horsemen, these FANG stocks have nothing to do with each other. Sure, they’re in the Internet space. They are each part of the Dow Jones Internet Index which is the only sector I see still hitting new highs recently (I guess Twitter’s stock must have not gotten the memo).
Take a look at each of the FANG charts. Then take a look at how many stocks are hitting new highs compared to how many were doing so a year or ago and a year before that. Compare this lack of participation sort of environment to that in 2007. Also look at the opposite scenario in the first quarter of 2009, where most stocks and sectors had already bottomed out in the 4th quarter of 2008. The “Market of stocks”, if you will, bottomed out in Q4 2008. It wasn’t until March of the following year that the indexes themselves put in their ultimate lows. To me we are looking at the opposite scenario today.
What do you guys think? Am I way off or perhaps on to something here?
***
Click Here for full access to my research. Feel free to look through our different packages. There’s a weekly research report here for everyone depending on your goals and approach to the market.
Tags: $QQQ $SPY $FB $AMZN $AAPL $NFLX $GOOG $RIMM $BBRY
Why I Like To Feed The Ducks When I Can

The concept of ‘Feeding the Ducks’ has come up in conversation more often recently. This is one of those things that I guess I just take for granted and only remember it’s importance after I see people’s reaction upon first learning the idea behind it. There are a lot of examples like this that I can think of, but when you do something every day of your life for years and years, certain behavior just becomes habit, and you begin to take that for granted.
Today I wanted to share with you guys why I think it’s so important to ‘Feed the Ducks’, and what it means to me. If you ask one trader or money manager what this means, you could get a completely different answer. A popular version I’ve heard in the past is that when a stock you own goes up 7-8 days in a row, or an unusual amount within a short period, you sell some. In other words, like feeding ducks in a pond and you throw pieces of bread out to the starving raft, you throw a bunch of offers out on your stock to provide supply to the chasers that missed the run you just benefited from. “Pouring a little out for the homies” or “Sacrificing some for the trading Gods” are other versions I’ve heard referring to the same concept. I’m sure there are plenty of others but those are a few that come to mind.
To me, it’s a bit different. I prefer to feed the ducks shortly after an entry, but specifically when I nail the entry. It doesn’t always happen like this, as we all know, but when you nail an entry point, long or short, it means that it immediately begins to work in your favor. On another note, a young trader I know once taught me that the best trades are the ones that start to work right away. But that’s another blog post for another day. Today I want to focus on feeding the ducks whenever you nail the entry point.
We’ll use this week as an example. After a fun weekend down in Miami for the Finance Festival, I got back to the charts Sunday night and Monday morning to see that the Nasdaq100 was failing beautifully to hold on to the new highs put in last week. People who know me and/or have been following me for a long time know how much I love these set ups. Simply put: from failed moves come fast moves in the opposite direction. The best part is that the risk was very well defined. The idea was that we only wanted to be short if $QQQ was below the July highs. Anything above that and we’re back to neutral, but if prices are below that we wanted to be aggressively short (there was a bit more behind this trade structurally as you can see here: The Nasdaq Flirts With All-time Highs). It doesn’t always work out this way, as we all know, but in this case, the trade began to work in our favor almost immediately.
This is where I most like to feed the ducks. How I calculate risk is that I take the difference between the entry point and the level where I’ve placed my stop and I calculate how many shares it would take for that difference to equal 1-2% of the portfolio, or how much risk specifically I’m willing to accept. In those instances where we nail the entry, a few days into the trade, as in this case, you take 5-15% of the position off the table, depending on how much risk we were taking to begin with. The point is that you run the math and you take enough profits to make this a risk-free trade. Now that we’ve made some profits, even if we get taken out of our original stop, we can’t lose on this position.
This is how I best interpret the concept of ‘feeding the ducks’. There is no right or wrong way to do this. I’ve heard many different strategies and it really all just depends on your time horizon and risk tolerance. These are all different for everyone and must be defined before ever putting on your first trade or investment anyway. For my interemediate-term time horizon where I look out weeks and months down the road, this way works best for me. The reason is that now I can let the profits run and be patient with booking gains because at this point we can’t lose. From a psychological point of view, this also now allows us to turn our attention to managing new positions and/or other positions already in the portfolio.
***
Click Here for full access to my research. Feel free to look through our different packages. There’s a weekly research report here for everyone depending on your goals and approach to the market.
Tags: $STUDY
Here’s Way I think Rates Are Heading Lower
All week I’ve been pretty vocal about why I want to be buying US Treasury Bonds down here, particularly the 30yr futures $ZB_F and the $TLT ETF. I keep getting asked about the Fed and whether or not they do this or that, who said what to who, etc. I don’t know what any of this has to do with our goal: to make money in the market. I can’t keep up with the gossip, and would prefer not to anyway, so instead we focus on the only thing that actually pays anyone: price.
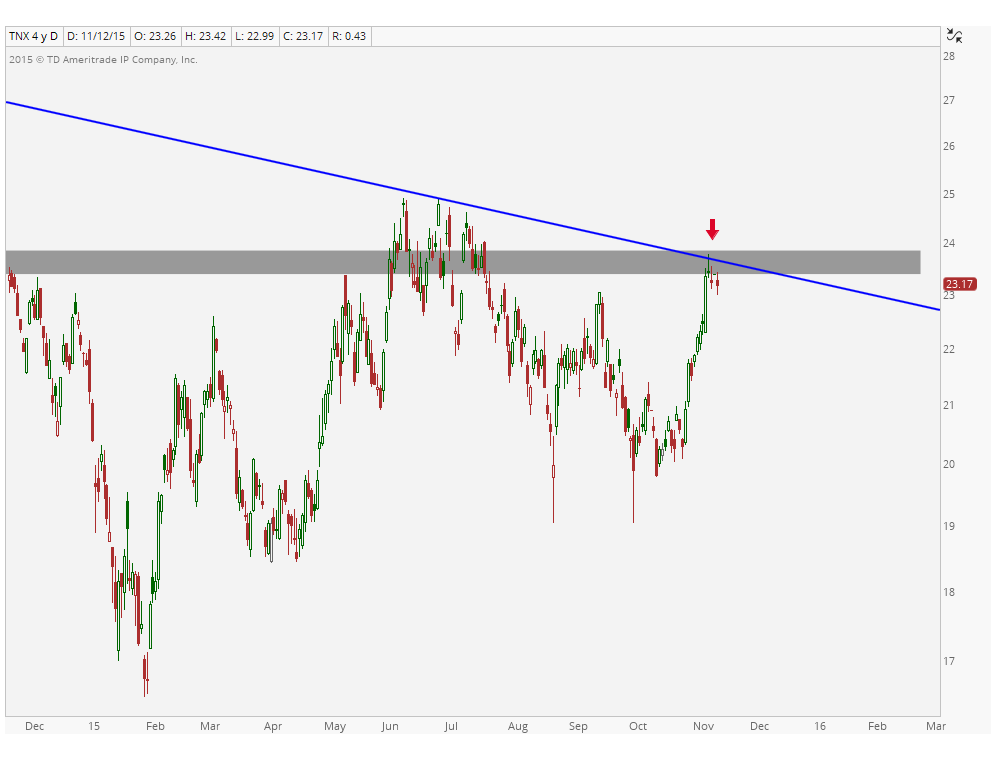
The negative correlation between bonds and rates is well known obviously. So when we talk about bonds, we want to look at rates. Here’s the 10-year Note Yield going back to the lows in 2010. This 2.3%-2.4% area is the big one. There’s a ton of market memory here as you can see:
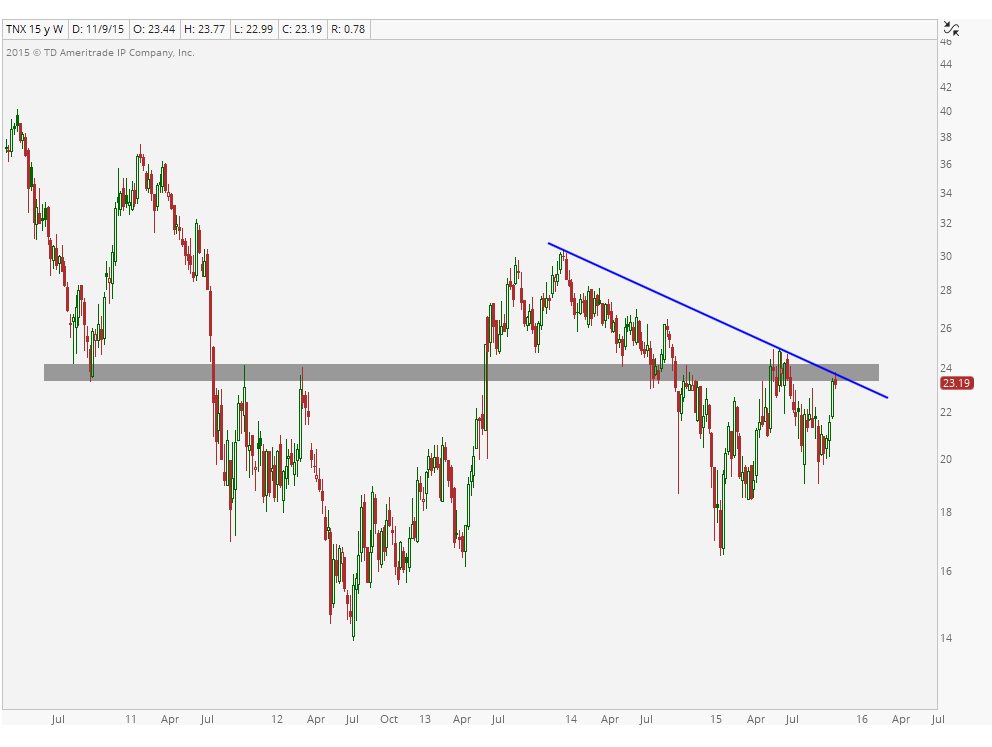
Looking a bit more short-term, we are also running into a key downtrend line from the late 2013 highs. Notice how up here is where the noise is getting the loudest about rates going up. See how this works?
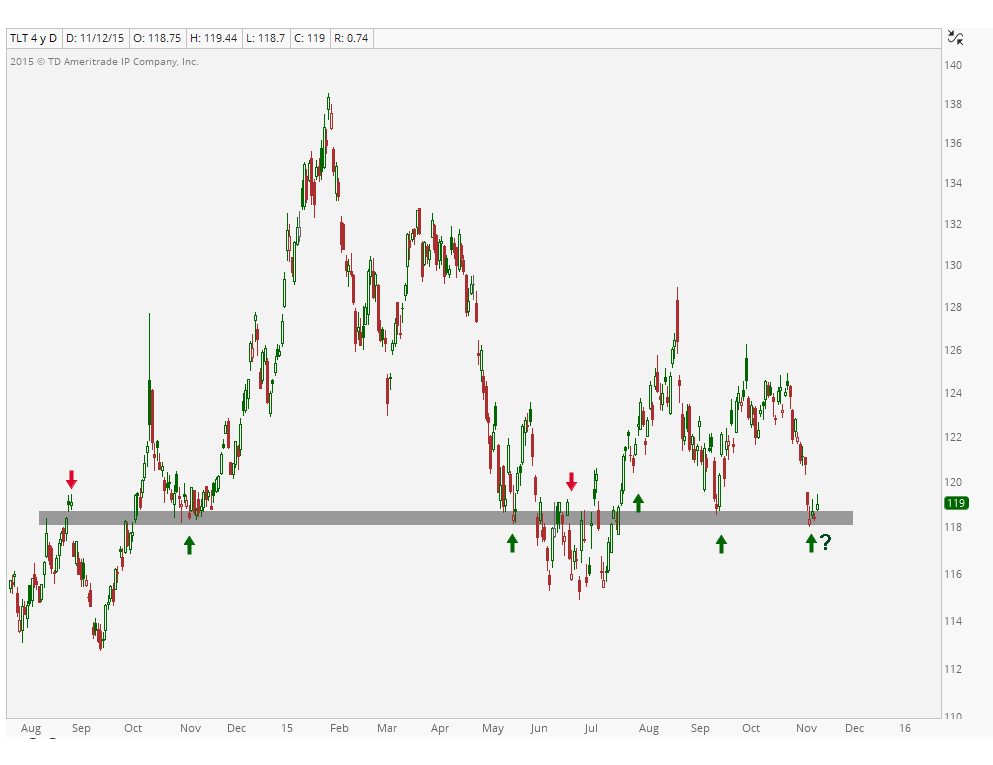
Now from an execution standpoint, we like the $TLT and 30-year Futures ZB_F. The levels have been clear. We’ve only liked $TLT on the long side if it’s above 118 (30-yr futures only above 151’10). This has been key support and resistance over the last year and gave us a solid risk vs reward this week:
You can see the periscope from this week where I explained this in more detail here: https://katch.me/allstarcharts/v/037d7f15-a788-36f5-9d40-51bfac5398ae
From a risk management perspective, the line in the sand is very well-defined. This is really all that matters to us anyway: the answer to the, “where am I wrong? scenario”. Looking at rates, if this downtrend line gets taken out to the upside and rates are holding above 2.4, then we will have to reevaluate this thesis. Although keeping an open mind (always), I think this is the lower probability outcome. I like buying bonds this week.
What do you guys think. Rates heading lower or what?
***
Click Here for full access to my research. Feel free to look through our different packages. There’s a weekly research report here for everyone depending on your goals and approach to the market.
Tags: $TLT $ZB_F $ZN_F $TNX $TYX
- « Previous Page
- 1
- …
- 746
- 747
- 748
- 749
- 750
- …
- 924
- Next Page »