I went down to the Nasdaq this morning to talk stocks, bonds and commodities on Business News Network. Check it out:
Source:
Technical Tuesday: A Take on the Trade (BNN)
Tags: $EWS $IDX $EIDO $EPHE $TLT $TNX $IEF TYX $NG_F $CL_F $UNG $USO
Expert technical analysis of financial markets by JC Parets
I went down to the Nasdaq this morning to talk stocks, bonds and commodities on Business News Network. Check it out:
Source:
Technical Tuesday: A Take on the Trade (BNN)
Tags: $EWS $IDX $EIDO $EPHE $TLT $TNX $IEF TYX $NG_F $CL_F $UNG $USO
In addition to the United States, it’s really been the Asia Pacific region that’s been leading global equities. Obviously Japan has been ripping all year long. But Indonesia, Malaysia, Philippines, and Thailand have been rocking all year as well. Singapore, on the other hand, has just been consolidating sideways for almost 5 months. Until last week.
We’ve been waiting patiently for this one. In early February we were hoping it was time for the breakout. But with European and emerging markets getting slaughtered after the Super Bowl, there just weren’t enough buyers to let her rip. But that was potentially a blessing in disguise. All that it created was an even bigger base, which could lead to an even bigger breakout.
As we discussed in our end of week video, the iShares Singapore ETF finally took out that 14 level and then held it for the rest of the week. This was our line in the sand and continues to be. Here is a daily bar chart of Singapore. As long as we’re above 14, this is an area we want to be involved in.
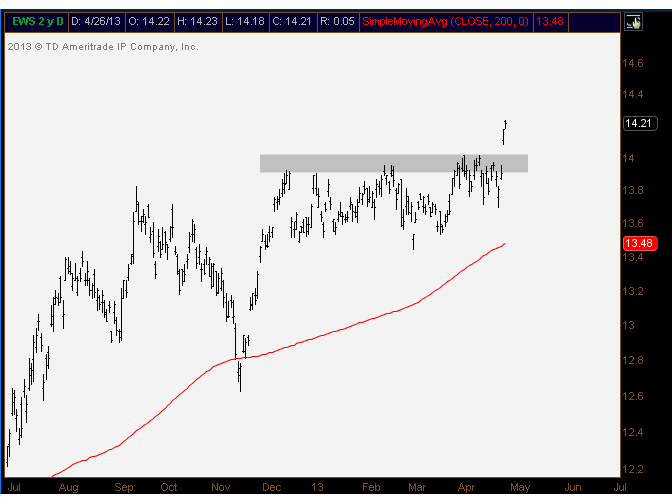
As they say, “the bigger the base, the higher in space”. And this one is coming off a major consolidation. The dividend adjusted chart (it pays a 3.8% yield) is making all-time highs. This area of the world is hot and I think that Singapore is now trying to play catch up.
Tags: $EWS $IDX $EIDO $EWM $DXJ $EWJ $THD $EPHE
So a couple of weekends ago Howard Lindzon invites me out to Coronado for his annual Lindzonpalooza event. Let me just begin by saying that this island has become one of my favorite places on earth. Howard lives some life. I was out there in the Fall for Stocktoberfest and Coronado was love at first site for me. No doubt about it.
Back in October, the event featured some of Howard’s tech startup buddies showing off their new venture as well as some of my stock market friends explaining their strategies. Brian Shannon gave a presentation, Joe Fahmy got up on the stage and did his thing, and when it was my turn, I explained how I view technical analysis. It was fun. I learned a lot and got to hang out with a bunch of my friends from around the country that I usually only see on stocktwits, twitter or through their blogs. It was a blast.
But this time was different. Howard asked me to come out and give a similar presentation, only this time, it was all tech startups and one technician. I’m pretty sure I was the only liquid markets guy at the entire event. And that may have been the best part. When you don’t know anybody, or very few of them, and are willing to admit when you don’t know something, it’s incredible how much you can learn in such a short period of time. And maybe more importantly, how many cool and brilliant people you can meet in one weekend.
I got there Thursday night so I didn’t have to travel during market hours and managed the book from the hotel room Friday morning. Another reason to love Coronado? Markets are closed at 1 and the weather is beautiful. It was 1:30PM and I’m sitting on a deck overlooking the beach drinking a beer with practically an air show taking place over my head. The Naval Base is on the island so the most ridiculous planes are coming in every 10 minutes or so. Talk about a great start to a weekend!
Friday night we go out for beers and I got to meet a lot of cool people. But Saturday morning was when the presentations got going. I wasn’t sure what exactly I had signed up for. But you know me, go party in Cali, meet some people and talk about charts? I can do that.
So Howard gets the morning going by doing about 20 minutes of standup comedy. He goes around the room giving credit where it’s due – a few of his buddies in attendance had recently sold their companies to the likes of Yahoo and Salesforce for some big numbers. Slowly but surely, most of his friends get made fun of and then Howard goes, “alright, now JC is going to tell you what he thinks about the world”. Thanks again Howard for giving me the heads up that I get to go first!
I was still getting my coffee ready when it was my turn to present. In a similar way to Stocktoberfest I went over all of the different aspects about technical analysis: momentum, seasonality, intermarket analysis, correlations, sentiment, etc. Then touched on my views in Mexico, Indonesia, precious metals, Treasuries, and a few other charts that I think tell an interesting story. I didn’t realize it until after, but I was literally speaking a foreign language to a community that does something completely different in their day to day stuff. But I got some great feedback. I think my approach to the market isn’t very complicated, purposely, so it definitely helped me on this day explain what I do, what I look at, and how I come up with conclusions based upon that work.
But forget me. Hopefully people learned something from what I said. But the truth is that I learned so much over the next few hours, that it can’t possibly compare to the chart stuff that I discussed. I can be here all day talking about the companies that presented. But here are a few that stood out to me:
StationCreator – Jon Labes who used to work at StockTwits is building some special for sure. This company allows you to essentially build your own streaming TV channel. You can set your viewing schedule with a combination of original content and embedded videos you may find elsewhere. You can then add it to a blog you already have or a website for your company. There are advertising dollars to be made there from commercials you add to your channel. No tivo here to fast forward through. Jon and I chatted for a while, good dude.
Life360 – This was one of the companies that really impressed me. It’s basically an mobile app that groups your whole family into one social network. But not a Facebook Jr, “hey mom I just had a PB&J for lunch and here is a picture of my friend’s dog”. It’s more of a “dinner is at 7, don’t be late”, sort of network. There is a killer GPS function that is designed in a way that doesn’t drain your phone’s battery. There’s a panic button that sends emails/texts to all of your family members in case of an emergency. There’s a “check-in” button that let’s teenagers tell their parents that they’ve arrived safely wherever they’re going, instead of having to call and tell them. I can definitely see why this company is growing globally and can provide a great service to a family.
MobileDevHQ – this to me just makes sense. Building an app that people want isn’t the problem. It’s the potential users finding your app that is the issue. So this company acts as a consultant to optimize your app search results through google and apple’s app store. They created a way that notifies them when the googles and apples of the world change their search algos and let you know how to change your title or explanation of your app to maximize your search results. This sounds like to me like a huge advantage to a company trying to sell their apps online.
Skyscraper – My friend Paul Burger is really creating something special here. His company helps bloggers monetize their content. Imagine what a pain in the neck it is to find companies that want to market themselves on your blog, then you have to charge them, schedule the banner ad, etc etc. The revenue generation will take up twice the amount of time it takes to write your blog posts. Paul’s company Skyscraper takes care of all of that for you so you can focus on creating content. It just makes sense. Really nice guy too.
Whitstream – this is the StockTwits for comedians. Instead of ivanhoff and I drawing lines on charts and sharing our thoughts on them, comedians make fun of political debates and award shows. It’s brilliant. Lisa Cohen had the room dying of laughter when she put of some of the examples on the stream. I don’t think there’s much to explain here, just go check it out.
And I can go on and on. Fanium, an app for fantasy sports, Embark that tracks email opening behavior to help companies send emails to customers at times they are most likely to open them, New Hive which let’s you build your own site (or expressions, as they call them) is great for artists and musicians, Videolicious is an app that allows you to edit videos and publish them within seconds, Anyone Home creates a solution for people looking to rent single family homes. These are some incredible companies.
And trust me, I’ve just done a horrible job of explaining what these companies do. There is so much more to it than what I just mentioned. Most of which I don’t understand, technology wise, but I’m trying my best. I strongly suggest looking up these companies and learning more about them. There is some afantastic stuff being built out there. And in reality, these are just solutions to a problem that these founders have had in the past so they created a company to solve that problem. It just makes sense.
One of the things I learned out there was how many steps ahead these guys are thinking. As my friend Chris Peacock from CNN Money put it, “this is heavy”. Companies are being built to solve problems in areas that are just starting to grow. The solutions they are providing will be used by people years from now, but they are getting it going today because they have the vision. I am so fascinated by the way these guys think. I was blown away.
So now I have all of these new friends I’ve made from all over the world. A lot of them are in California obviously and a bunch from Canada. I learned so much by just shutting up and listening. And sure, I asked stupid questions. I’m willing to admit this isn’t my world. When my pal Dan Schleifer, Founder of ChartIQ, was explaining his new app using HTML5, I joked and said, “right, as opposed to HTML4 right?”. And he looks at me and he says, “JC you know you’re the only person here that doesn’t know what the difference between them is right?”. I know. So I learned. I learned a lot.
It was such a privilege for me to be there among some of the smartest people I’ve ever met. I got to see some really cool companies that are creating some incredible products. I have all of these new friends. And I got to hang out in Coronado for the weekend. I told Howard if he keeps inviting me out there, one of these days I’m just going to stay and not come back to New York. The place is really that awesome.
Great event, to say the least. I know charts and I know sports. Tech Startup, not so much. So go learn more about some of these companies that I did a poor job of explaining. Trust me, I think it’ll be worth your time.
Thanks again Howard.
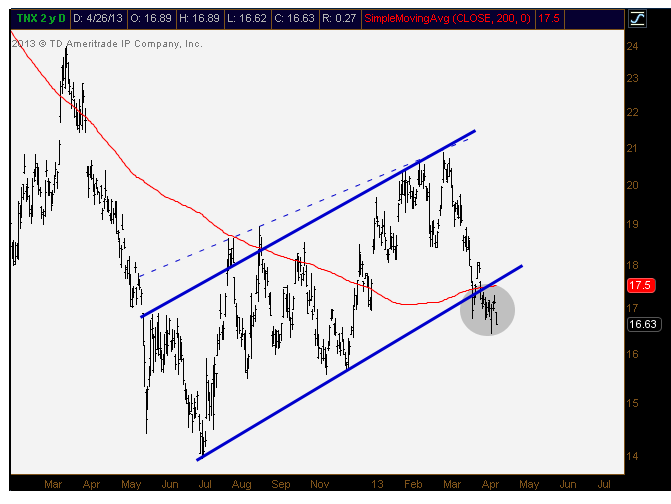
Phil and I did a quick video about the markets after the close Friday. We touched on S&Ps, the continued strength in US Treasuries, and a fresh breakout in Singapore. Check it out:
10-year US Treasury futures went out at new highs
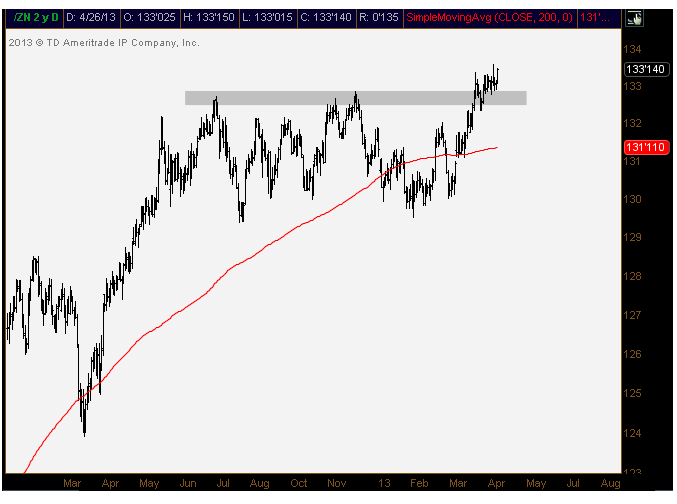
10-year yields at new closing lows for the year
Singapore breaking out
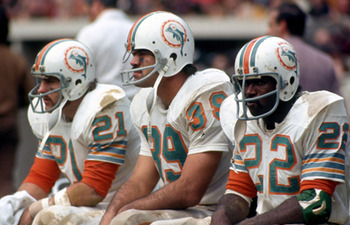
JNJ is now up 17 weeks in a row. Reminded Phil of the Miami Dolphins in 1972 who went 17-0
Tags: $TNX $TLT $IEF $ZN_F $EWS $SPY $JNJ
We’ve all heard it before. It gets talked about every year right around this time. But what does it mean exactly? Where does this saying come from?
Well, legend has it that it derived from the British. The original phrase goes, “Sell in May and go away. Stay away till St. Leger’s Day”. So basically, in a similar way that market moving new york fund managers go out to the Hamptons for the summer, slowing down the stock buying, out in England they don’t get back to business until Horse Racing season is over in the Fall. The last leg of the English Triple Crown, the St. Leger Stakes, is a huge celebration that goes back to the late 1700s. We Americans like to call that Football Season.
So the annual cycle is very simple: you buy stocks in November and sell them at the end of April. “The worst six months”, as my friend Jeff Hirsch likes to put it, begins next week (See my Dow Chart here). The numbers historically are incredible. Let’s say you had invested $10,000 in the Dow Jones Industrial Average in November of 1950, sold it all at the end of April 1951, and did that every year since, you would have made $674,073 by 2011. Now, had you done the opposite with that $10,000 and bought in May and sold on Halloween every year since 1950, you would have somehow lost $1,024 during that same time. So in other words, every single dollar made during that 60+ year period in the Dow was made during “The Best six months” of the year. That is just unbelievable to me. I’ve been aware of these stats for many years and it still impresses me every time I read it or say it out loud.
Now, as we all know and has been well documented, post-election years are typically some of the worst of the four-year Presidential cycle. And as it turns out, the best/worst six month trading strategy gets affected as well. From the Stock Trader’s Almanac:
“Post-presidential-election years, such as this year, have the worst performance record out of the cycle. Since 1833, post-election years on average have gained just 2.0% (up 20, down 24). In comparison, top performing pre-election years have gained 10.4% on average (up 34, down 11). As May nears, the following historical look at how DJIA has performed during the Worst Six Months of post-election years since 1905 should prove useful while trying to decide whether or not to “Sell in May” this year”
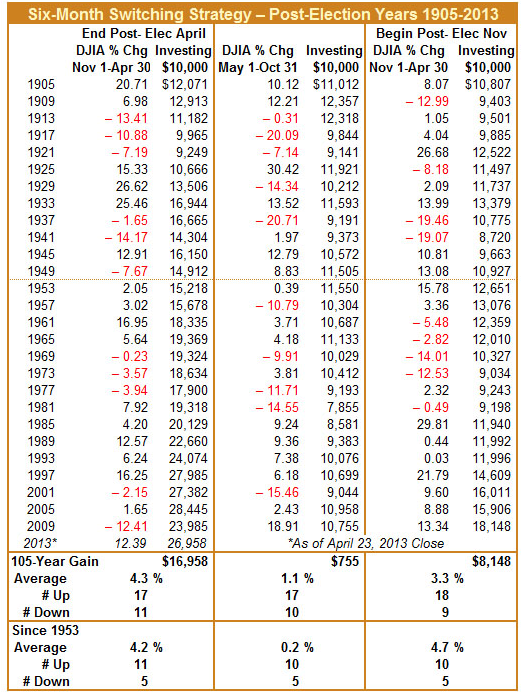
“Two sets of averages are presented. The first is the DJIA’s includes all data since 1905 while the second starts at 1953. Prior to 1950 the U.S. economy (and the global economy) was substantially different than now. From 1901 to 1951 farming made August the best performing month of the year. This is no longer the case and August is now the second worst month of the year.
Largely due to the fact that post-election years generally perform poorly, there is little difference in the overall outcome whether or not years before 1953 are included or not. The ratio of advancing/declining “Worst Six Months” is nearly the same around 2:1, although the average gain during the “Worst Six Months” since 1953 is significantly smaller, virtually flat. Also of note is there has been just one double digit gain (2009) during the “Worst” months of post-election years since 1953. While there have been four (five if rounded) double-digit declines. DJIA’s performance from 1985 to 1997 is also impressive, but those results are from the last secular bull market that lasted from 1982-2000, not the secular bear of the last decade-plus.”
So what have we learned? Number 1: “the worst six months of the year” really are the worst. And number 2: in post-election years, they’re somehow even more vulnerable to correct. So let’s keep these stats in mind as we make all-time highs in some of the major US averages.
We’ll continue to let price dictate our actions, that will never change. But I think it’s prudent, as always, to be aware of the seasonality in the stock market. Nothing wrong with that. In fact, to ignore it I think would be irresponsible of us.
Source:
Sell in May, Post-Election Year Edition (StockTradersAlmanac)
Tags: $DJIA $DIA $DJI
There’s something happening in the Materials space today that is worth mentioning. First of all, lets just agree that this is the most hated space in the world – gold miners, copper, and materials in general. They’ve been getting crushed with emerging markets all year while staples and healthcare rip higher here in the states. Freeport McMoran has always been my go-to name when it comes to this world. You’re getting a healthy combination of gold and copper in one 30 billion dollar stock.
Over the last couple of weeks, we’ve been monitoring $FCX as it tests/breaks this multi-year support. The mentality is that a severe breakdown in this name could have massive implications for the global macro environment. If this thing goes into free-fall, risk assets as a group are probably in big trouble. The economic implications of more copper selling, combined with our favorite stocks being used as a source of funds for global margin calls would be a major problem.
Now let’s just take the other side of this for a minute. What happens if Freeport doesn’t break and collapse? What happens if gold and copper finally catch a bid? Can $FCX actually squeeze higher? What would renewed strength in materials and emerging markets do to risk assets, and particularly sector rotation within US Stocks?
Here is a weekly bar chart going back pre-2008 crash. The current levels being tested represent horizontal support from both the 2010 and 2011 lows and also the 61.8% Fibonacci retracement of the entire move off the 08 bottom:
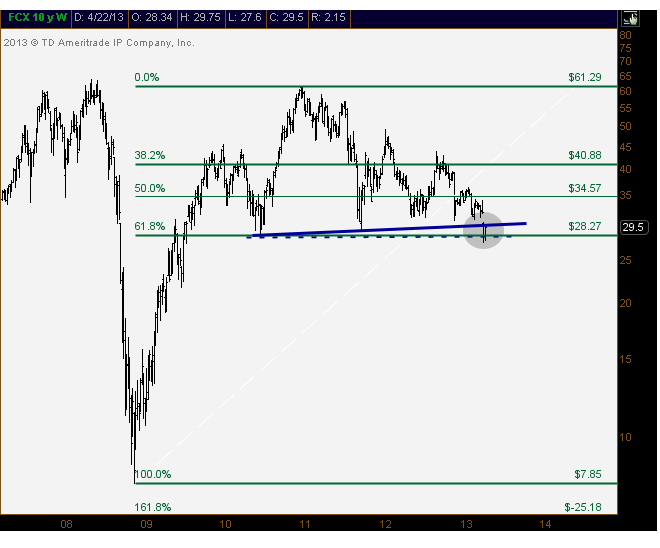
I’m not suggesting one is going to happen and not the other. But simply pointing out that there is something significant happening right now in a very important name. The resolution here will probably impact the near future of the marketplace and what you’ll be reading about on the beach this summer.
Tags: $FCX $JJC $HG_F $GDX $GC_F
The Dow Jones Industrial Average has put in a short-term top right about now in each of the past three years. I’m not saying that we need to see a fourth in a row. In fact, it typically isn’t that easy. But I think it’s worth pointing out how on point the ‘Sell in May and Go Away’ strategy has been, at least for the short-term.
I don’t think this is anything to make portfolio altering decisions about, but it’s definitely fascinating to see the seasonality take effect every year.
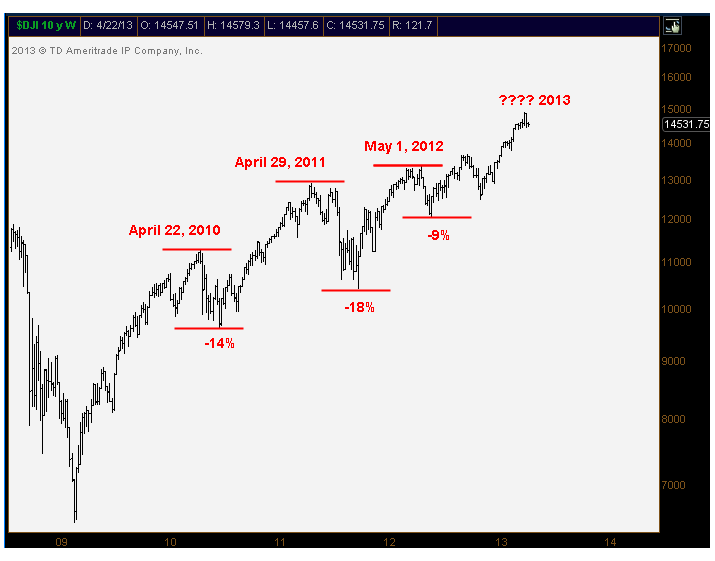
Going forward I think it’s important to look at price to make risk management decisions. But I don’t think there’s any harm in keeping the seasonality factors in the back of our minds. Regardless of what transpires over the next several weeks/months, this pattern is definitely worth pointing out.
Remember, they’ve corrected each year right around this time. But these corrections have just been buying opportunities within this ongoing cycliclal (perhaps secular) bull market. And I don’t see evidence of that bigger picture thesis changing just yet.
Tags: $DJIA $DIA
Something interesting happened over the weekend that you may or may not have missed. Barron’s came out with their sentiment numbers that are published just twice a year. As it turns out, 74% of money managers were bullish over the next 6-12 months. This represents the most amount of bulls in the 20-year history of the Barron’s Big Money Poll. Here is what the cover page looked like on Saturday:
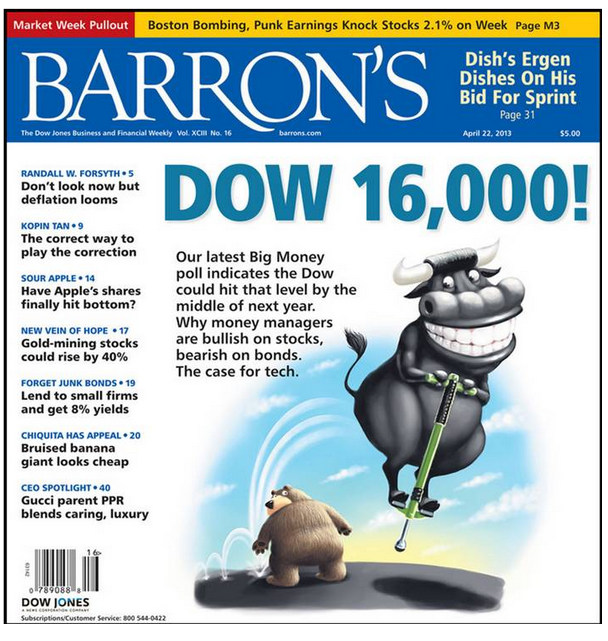
This is a nice bullish front page, considering there were more bulls in this poll than ever before. But this comes after the S&P500 rallied over 10% and made all-time highs since the last poll in October. Back then, just 46% of those polled were bullish. And look how different the cover of Barron’s was in that issue:
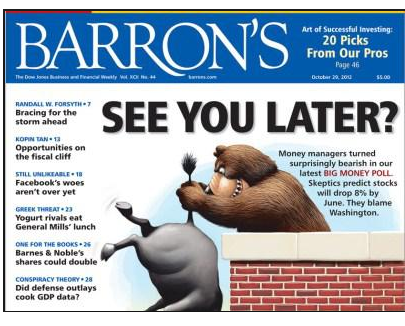
The bears were certainly in control of sentiment at that point, as both the poll numbers and the cover tell the story. And let’s not blame Barron’s, but actually give them credit for expressing in a drawing how the investing public is feeling. It’s not Barron’s job to be right or wrong, but to print what’s going on in the marketplace. And I think they do a fine job. These two covers show that well.
But from a contrarian standpoint, this is interesting for sure. When you dig deeper into the poll numbers, you’ll see that just 7% of those polled this Spring were pessimistic, compared to 27% six months ago. 86% of those polled were bullish equities over the next 6-12 months compared with just 11% bullish fixed income (bonds). So plenty of optimism this time around.
I’m looking forward to seeing how these poll results have changed when they come out again in October…
Sources: