It’s the weekly bond edition of What the FICC?
The Silicon Valley Bank $SIVB collapse dominates the week’s headlines.
While risks appear isolated for now, unlike in 2008, the next chart reveals a storm brewing beneath the surface…
Expert technical analysis of financial markets by JC Parets
It’s the weekly bond edition of What the FICC?
The Silicon Valley Bank $SIVB collapse dominates the week’s headlines.
While risks appear isolated for now, unlike in 2008, the next chart reveals a storm brewing beneath the surface…
From the Desk of Ian Culley @IanCulley
US bank stocks big and small took a beating Thursday, with the Bank ETF $KBE posting its largest single-day decline since 2020.
The steep sell-off came on the heels of Silicon Valley Bank’s $SIVB Wednesday announcement of a $1.8B loss, mainly due to accepting unrealized losses in US Treasuries.
Based on SIVB’s acute exposure to the tech industry, you can argue larger banks with more diversified portfolios and clients don’t carry the same risk. And they don’t.
Regardless, the next chart reveals a storm brewing beneath the surface…
It’s the weekly currency edition of What the FICC?
Dollar and rates were big themes last year – rising in tandem – and continue to be as we head into March.
It shouldn’t come as a surprise as the next chart reveals the crux of the story…
Check it out!
From the Desk of Ian Culley @IanCulley
What year is it?
Is it 2023 or 2022? Because it’s starting to feel like last year all over again…
No, Will Smith hasn’t slapped anyone (that I’m aware of). And I’m confident Bennifer 2.0 is going strong (solely based on Superbowl commercials).
But that’s not my concern. Here’s what does have my attention: the dollar and rates.
These were big themes last year – rising in tandem – and continue to be as we head into March.
It shouldn’t come as a surprise as the next chart reveals the crux of the story…
From the Desk of Steve Strazza @Sstrazza.
Welcome back to Under the Hood, where we’ll cover all the action for the week ended March 3, 2023. This report is published bi-weekly and rotated with The Minor Leaguers.
What we do here is analyze the most popular stocks during the week and find opportunities to either join in and ride these momentum names higher, or fade the crowd and bet against them.
We use a variety of sources to generate the list of most popular names.
There are so many new data sources available that all we need to do is organize and curate them in a way that shows us exactly what we want: a list of stocks that are seeing an unusual increase in investor interest.
Whether we’re measuring increasing interest based on large institutional purchases, unusual options activity, or simply our proprietary lists of trending tickers, there’s a lot of overlap.
From the desk of Steve Strazza @Sstrazza
Our Top 10 Charts Report was just published.
In this weekly note, we highlight 10 of the most important charts or themes we’re currently seeing in asset classes around the world.
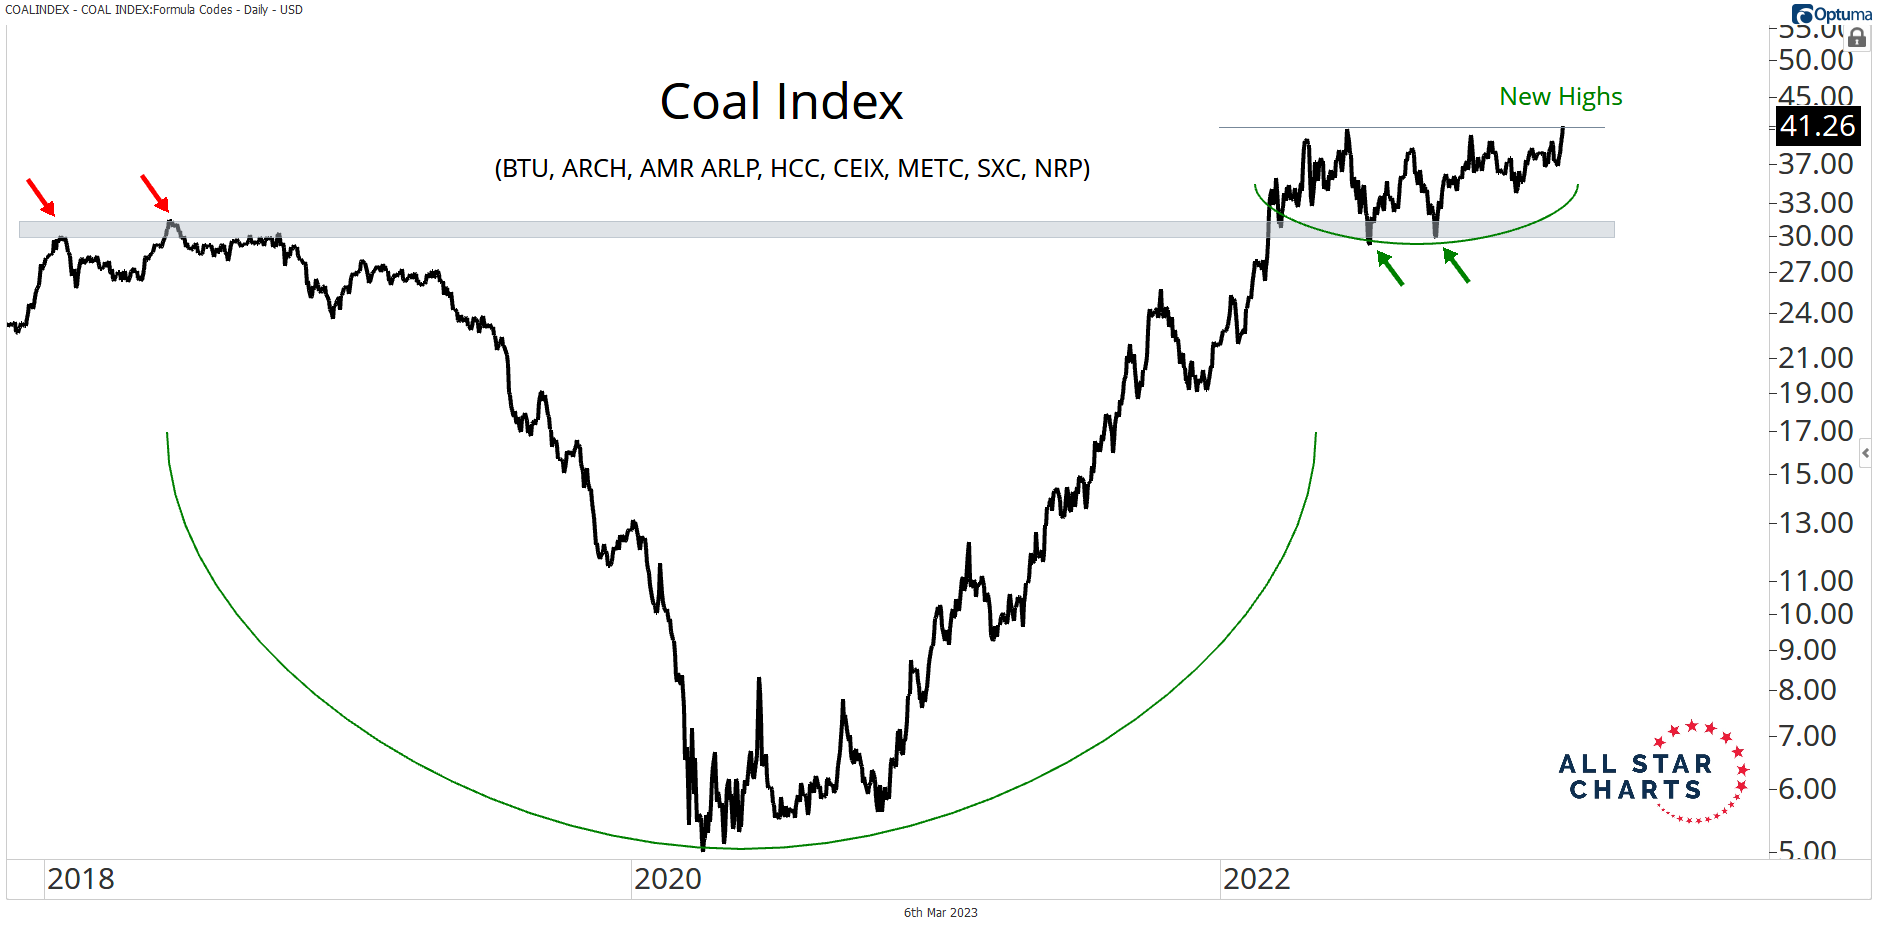
Don’t Ignore Coal
Our equal-weighted custom index of the largest coal stocks reached new highs last week. If this breakout sticks, coal is a group we want to keep leaning on for long exposure.
From the Desk of Steve Strazza @sstrazza and Alfonso Depablos @Alfcharts
This is one of our favorite bottom-up scans: Follow the Flow.
In this note, we simply create a universe of stocks that experienced the most unusual options activity — either bullish or bearish, but not both.
We utilize options experts, both internally and through our partnership with The TradeXchange. Then, we dig through the level 2 details and do all the work upfront for our clients.
Our goal is to isolate only those options market splashes that represent levered and high-conviction, directional bets.
 We also weed out hedging activity and ensure there are no offsetting trades that either neutralize or cap the risk on these unusual options trades.
What remains is a list of stocks that large financial institutions are putting big money behind.
And they’re doing so for one reason only: because they think the stock is about to move in their direction and make them a pretty penny.
Then we flip through our list of stocks flashing unusual activity and pick the best setups using many of the same technical filters we do for our other scans.
And, just like that, we’ll follow the money flow and fatten our own pockets along with some of the world’s most powerful financial institutions.
From the desk of Steve Strazza @Sstrazza
Check out this week’s Momentum Report, our weekly summation of all the major indexes at a Macro, International, Sector, and Industry Group level.
By analyzing the short-term data in these reports, we get a more tactical view of the current state of markets. This information then helps us put near-term developments into the big picture context and provides insights regarding the structural trends at play.
Let’s jump right into it with some of the major takeaways from this week’s report:
* ASC Plus Members can access the Momentum Report by clicking the link at the bottom of this post.