As we close out 2015, one of the biggest stories of the year has to be the crash in Energy prices. The CRB Commodities Index is heavily weighted in Energy and, as an Index, has fallen over 20% this year now down almost 65% from its peak in 2008. Here is how I think we can profit from this in 2016: [Read more…]
[Premium] Our Weekly Letter About The Current Market Environment
In this week’s members-only letter we discuss the following topics:
- What We Need to See For Crude Oil To Bottom
- How High Yield (Junk) Bonds will Move in January
- What the Period of the Santa Claus Rally Really Means
- Is The U.S. Dollar Still a Short?
- How Crude Oil could affect Energy Stocks in the First Quarter
- What do we do with Uranium in 2016
[Premium] Our Weekly Letter About The Current Market Environment
Dear Members,
Thank you to everyone who registered for the new All Star Charts membership. I’m super excited to have you guys as part of our team. Remember, we’re all in this together trying to navigate through this market day in and day out. It’s a puzzle that is constantly evolving and what we’re here to do is look for major trends around the world and then break those down to find more intermediate-term investing opportunities based on those structural setups. The new All Star Charts was an idea we’ve been working on for a long time, so we couldn’t be happier to finally be able to share the ideas and the homework that I already do with all of our new members. Welcome to our club!
For the past 2 months I’ve been very vocal about how there’s been no reason to own the major U.S. Stock Market Averages. If there’s been any trade to be made, it’s [Read more…]
Video: The 10 Best Charts In The World
We have a lot going on these days here at All Star Charts, but I wanted to put together a conference call to get us all in one room and discuss what I think are currently the Best 10 Charts in the World. Most of them come along with a few more charts or data points to either help tell the story better or help with tactical risk management procedures.
Going forward only Members of All Star Charts will have access to these monthly conference calls as well as the intra-month conference calls whenever market volatility dictates.
Start your 30-day Risk-Free Trail Today: All Star Charts Premium
Become A Member of All Star Charts Today!
Tags: $SPX $SPY $EEM $XLF $QQQ $COMPQ $AAPL $XBI $WMT $IBB $GLD $SLV $UNG $USO $TLT $TNX $NIB
[PREMIUM CONTENT] An Open Letter About Today’s Market Environment 12-3-15
Dear Readers,
For the past few weeks I’ve been writing a weekly open letter to readers about what I’m seeing across the stock market, bond market, commodities and currencies. The feedback I’ve received has been unlike any other time in the 5 year history of All Star Charts. I want to thank all of you for that. I think this is something that I will have to continue to do and make it a regular part of my routine. I’ve done this sort of thing in the past while managing money in order to keep our investors up to date on how we want to approach the marketplace. The format you’re seeing here is no different. Please feel free to keep emailing me and contacting me via Stocktwits or Twitter on how it can improve and what sort of things you guys want me to talk about.
Starting with the U.S. Stock Market, this as a group continues to be in no-man’s land. When price is near a flat 200 day simple moving average, the market is suggesting that there is [Read more…]
An Open Letter About Today’s Market Environment
November 18, 2015
Dear Readers,
We are just about 6 weeks away from finishing up 2015 and as usual there are a lot of questions left unanswered. Now is as good of a time as any to look back at how we got here so we can take a weight-of-the-evidence approach and put together a thesis of what we should expect going forward. At AllStarCharts, we prefer to incorporate a global top/down approach focusing our attention on various liquid asset classes with exposure both domestically and outside of the United States. With our long/short mentality, we look for opportunities to profit from both good and bad markets striving for absolute returns regardless of the economic environment.
Today we’ll start with the U.S. Stock Market which is relatively flat year-to-date. In large-caps, the S&P500 and Dow Jones Industrial Average have gone nowhere this year, while the leader has been the Nasdaq100 (up 10% YTD) and the laggard is obviously the Dow Jones Transportation Average (down over 10% YTD). With the tremendous amount of dislocation between Transports and the Tech-heavy Nasdaq, we’ll call that a wash and chalk this year up as flat, at least for now. The problem is, that the indexes don’t tell the whole story. Even before the August sell-off, the amount of stocks still making new highs was an embarrassment as only a small percentage of them were still rallying. The Consumer Discretionary space and the Dow Jones Internet Index were two standouts without much company. Looking at things today, and over the past few weeks, even fewer names are participating. The Nasdaq100 was the only index to make new highs this month as the rest rolled over putting in lower highs across the board.
The word “Distribution” really explains what is going on here in the U.S. Stock market. We can see a massive topping pattern forming in the S&P500 right at the 161.8% extension of the entire 2007-2009 decline. We don’t look at this as a coincidence. This distribution is also taking place at exactly the March 2000 highs for both the Nasdaq Composite and the Nasdaq100. Again, not something we consider to be a coincidence. The question we want to ask going forward is simple: with very few sectors and stocks in the market left participating to the upside, is this the tell before a much bigger sell-off, or will certain sectors take leadership and carry this market higher going forward? In the S&P500 alone, almost 70% of stocks have corrected over 10% and close to 40% of them have fallen over 20%. Will this “market of stocks” collectively stabilize, rotate leadership and head higher? I would argue that no, this is definitely the lower probability outcome and in all likelihood we are heading much lower. From a risk vs reward standpoint, this still very much favors the bears. My levels are 114.40 for $QQQ AND 2080 for the S&P500. We only want to be short these averages if prices are below them and neutral if we are above.
Within the U.S. stock market, since we have a negative bias, we want to focus our attention on the laggards. With the Dow Jones Transportation Average easily the worst of the bunch, I think Airlines are the ones we want to short. Looking specifically at the Amex Airlines Index, we are seeing the exact opposite of what we saw in March 2009. If you recall, while the market as a group was putting in lower lows in the first quarter of 2009, the Airlines held in showing the relative strength at the time to spark a 330% rally, which by far and away outperformed the S&P500 and other indexes. Today, it is the relative weakness that is standing out as this index has been making lower lows all year in an environment where the other indexes continued higher into the Summer. The uptrend line from the 2009 lows in the Amex Airlines Index has now been broken and over the past few weeks have successfully retested it and rolled over. Momentum is in a strong bearish range and prices are trending below a downward sloping 200 day moving average. Bad things tend to happen in this type of environment. We want to be aggressively short a basket of these airlines as long as prices remain below the broken uptrend line from the 2009 lows. I would be adding to shorts if we break the lows from this week. Also see the ETF $JETS.
Looking more globally, it is hard to ignore the underperformance out of the New York Stock Exchange Composite. Although considered a local exchange, half of the biggest 100 names in this cap-weighted composite are foreign companies. The relative weakness here is further evidence that the U.S. is still the leader compared with the majority of the international stocks markets. The emerging space is particularly weak as the S&P500 is sitting at or near 11-year highs relative to the MSCI Emerging Markets Index. In the more developed countries, the Japanese Nikkei has held in relatively well compared to the U.S., but is currently in no-man’s land at best. Whether looking at the Nikkei specifically, or the Hedged Japan ETF $DXJ, which we like to use, with prices trading near flat long-term smoothing mechanisms, this is a headache waiting to happen and we want to stay away from it. I would put Germany in a similar neutral category, but leaning on the bearish side on both as we are below broken support which is new overhead supply in the Nikkei and the DAX.
On the long side of the International markets, I think the potential for further mean reversion in Latin America is certainly there, but it’s the probability, or lack thereof, that annoys me. We are focused on the Latin America 40 Index ETF $ILF and specifically within that group, the MSCI Brazil Index ETF $EWZ. Coincidentally, it would take breakouts above $25 in each of these to get me bullish and long for that mean reversion towards 28. But that’s all I’m seeing there.
Crude Oil is likely to have an impact in this space. I’ve been in the camp that Oil has bottomed out, although tactically I see little reason to be long from current levels. I’d like to see more backing and filling to create a base large enough to get this one going. Looking at this from a more structural perspective, the high 30s-low 40s was where Crude Oil prices would peak throughout the 1980s and 90s. Once that range broke out to the upside after the turn of the century, we expect this to be an area where prices bottom out instead. So I think we’re close. We are watching Heating Oil and Unleaded Gasoline futures as the tell. If prices can get and hold above the lows from throughout 2015, which are awfully close, I think that Oil can bottom out. If we start to see new lows holding in these other energy commodities, I think we’re in a lot of trouble in Crude Oil and anything with a positive correlation to the commodity.
Where I would prefer to focus my attention instead within energy is Natural Gas. In September of 2009, Natural Gas bottomed out at $1.92 before rallying above $7 over the next few months. In April 2012 the bottom was $1.83 before rallying over the next 2 years above $7 again. Last month Natural Gas hit $1.94 before reversing higher. This is one we want to own for a 20% rally here back towards $3. This is a tactical trade where for risk management purposes, nimble traders can use 2.40 as the line in the sand. Contracts roll next week, so adjust accordingly ($2.55 in Jan Futures). According to the CFTC, Commercial Hedgers, who we consider “the smart money”, currently have one of their largest long positions of all time. Bigger picture, the Crude Oil:Natural Gas ratio continues to fall. This bubble peaked at over 50:1 in early 2012 and the mean reversion back to the single digits is running its course. Today the ratio sits around 18:1, from a high of over 50:1 with a long-term average near 10:1. Also remember that we are in a reversion beyond the mean business, and not just a reversion to the mean. So an overshoot into the single digits in the ratio is most likely.
Moving over to the precious metals space, it’s hard to find a more beautiful downtrend out there in the world. With prices hitting new 5-year lows this week, sentiment is nowhere near as pessimistic as it has been at prior temporary lows in 2013 and 2014. I think this bullish (less bearish) outlook from the public will be the catalyst to take Gold under $1000 and Silver under $12. The risk/reward today is not as clean as it once was a few weeks back, but the trend here is lower and we want to continue to fade any strength in metals.
The U.S. Dollar should have an impact in this group as it has consolidated its gains from the past few years in one of the healthiest consolidations across the global marketplace. Back in March, we saw the most bullish sentiment towards the Dollar in history. The Commercial Hedgers were selling this thing like if it was going to zero. Anecdotally, the financial media who has never cared what I thought about the U.S. Dollar could not finish a phone call or email with me without asking my thoughts on the Dollar. Since then, however, the sentiment has dissipated and the hedgers have covered a lot of their bearish positions. It’s hard not to like the Dollar here. I think it continues to head higher after the recent breakout. This should have negative implications towards the Euro, which represents close to 60% of the U.S. Dollar Index. I would expect the Euro to continue to fall along with precious metals as we head into the first quarter of next year.
Next we turn to the Bond market. The collective waste of time of arguing about fed hikes or not continues to dominate the airwaves and interwebs. We try and ignore what the Fed has to say as much as we can and even more so Wall Street Economists. There is no group on planet earth that has been more wrong about anything as Wall Street Economists have been about the Fed. We prefer instead to focus on price, which at the end of the day is the only thing that will pay us. First of all, we are talking about a 35 year bear market for rates. Things don’t just turn on a dime. So to blindly short the bond market because “rates can’t go any lower” makes zero sense to us. Now, the short end of the curve and the long end are two different things. The 2-year US Treasury bond yield is highs this week not seen since 2010, but the 30-year yield hit fresh lows earlier this year and has not shown any signs of a major bottom. This dislocation has caused the yield curve to narrow. Note that an inversion of the yield curve (short-term rates exceeding long-term rates) is a heads up of a pending economic recession.
Since we don’t have time to sit around waiting for yield curve inversions, we prefer to focus on the here and now. Looking at the 10-year yield, widely considered the benchmark for U.S. Interest Rates, it’s the 2.4% level that stands out the most. This was the low in rates in 2010 and also twin highs in late 2011 and early 2012. We kissed that this month and quickly rolled over. Going forward, this is our line in the sand. As long as the 10-year is below 2.4%, we want to be buying U.S. Treasury Bonds very aggressively, particularly the 30-year Futures $ZB_F. Equity traders can turn to the iShares 20+ Year Treasury Bond ETF $TLT or $TLT options for non-futures exposure. We are not expecting any rate hikes in 2016 and regardless of any rumors, we want to be buying bonds here.
That’s it for now. Please feel free to write with any questions or comments that you may have.
JC
***
Note: In next week’s letter we will spend time looking at Biotechnology, Palladium, Agricultural commodities and equities and some individual U.S. stocks like Apple, Amazon and Netflix on both the long and the short side.
Tags: $SPY $QQQ $UNG $USO $CL_F $NG_F $GC_F $GLD $SI_F $SLV $UUP $DX_F $EURUSD $FXE $TNX $TLT $ZB_F $HO_F $RB_F $EWG $DAX $NIKK $DXJ $USDJPY $6J_F $FXY $ILF $EWZ $XAL $JETS
It’s Almost Time To Buy Crude Oil Again
It’s been a while since I’ve written about Crude Oil here on the blog. It’s a topic that has been coming up more often recently as prices are hitting levels not seen in over 6 years. Just because something is in the news a lot doesn’t mean it is a market that is worth our participation. In fact, more often than not, if it’s all over the news, you probably either missed it, or you’re too early. We have preferred to stay away from Crude Oil since it broke the uptrend line from the March lows. This occurred in mid-May after a 30% rally in Crude Oil that was sparked from the failed breakdown and bullish momentum divergence that we were pointing to in March. This worked out well the first time around and now I believe we are about to see something similar.
Technical analysis is not an exact science. For that matter, any form of market analysis is subjective and can be better categorized as an art, even fundamental analysis. There are no perfect right or wrong answers. By definition, no one knows what will happen in the future. Today I think I can provide a good example of a subjective approach to a market that may or may not work, but at least there is a risk vs reward opportunity that is skewed towards one side. In a similar way to how in March, we did not know whether Oil prices could climb back above the January lows (although we hoped for it), today we do not know if Oil prices can climb back above $43 to trigger another entry point for us. Let me explain.
Here is a daily candlestick chart of Crude Oil futures breaking down to lows not seen since 2009. There are a few things going on here that I think are worth pointing out. First of all, prices have now come down to the downtrend line connecting troughs since those January lows. There are multiple downtrend lines here because both make sense. We therefore look at this as more of a support “area”, than an exact point. In addition, we are just below the 161.8% Fibonacci extension of the January rally. Remember this January bounce is the reason we liked it in March in the first place. So we will continue to refer to this move going forward as the most relevant move.
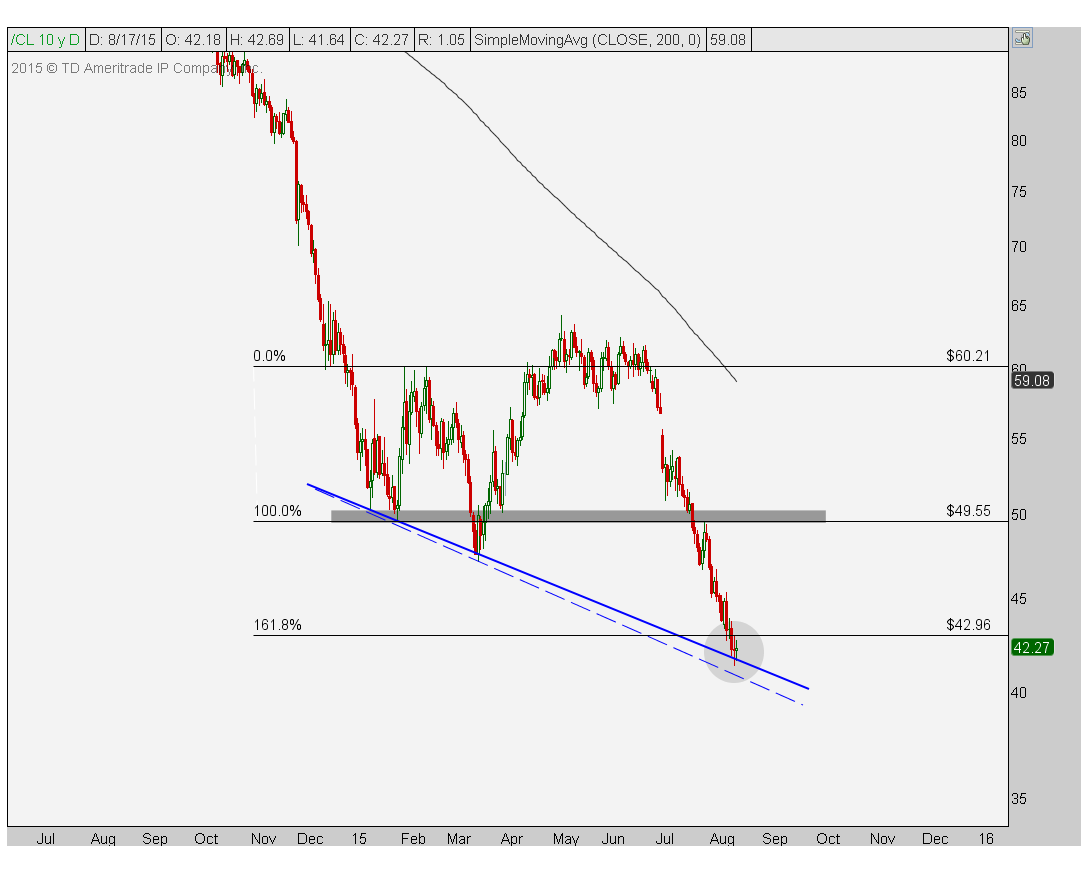 Again, this is an art and not an exact science. Maybe the market will roll over again and not bottom out until prices reach fibonacci extension levels based on the entire March-May rally. We have no idea. But the weight-of-the-evidence is suggesting that this area near $41.50-43 is worth watching as a possible entry for a mean reversion.
In addition, sentiment has now come down to levels not seen since December of 2001. If you recall, this was when Oil bottomed out after peaking in the Fall of 2000 just before it rallied from $17 towards $150. Our sentiment data suggests we are at a similar bearish consensus (via SentimentTrader.com).
From an execution standpoint, I think it’s pretty simple. Based on this $43 level representing the 161.8% Fibonacci extension of that key January rally, I do not see any reason to be long Crude Oil if we are below that. This is our line in the sand. If prices are above that, then I can make an argument to be aggressively long only above $43. Since those January lows were such an important support level, I would expect there to be some sort of reaction upon retesting that price. This overhead supply should become resistance on any strength towards that area. Notice how in late July after breaking those January lows, prices bounced off the March lows, retested the January lows, and then rolled over again. This reiterates to us how important $49.50 is going forward. From a tactical perspective I would be a seller of strength into that price. This represents about 15% of upside near term with very well-defined risk (only long above 43).
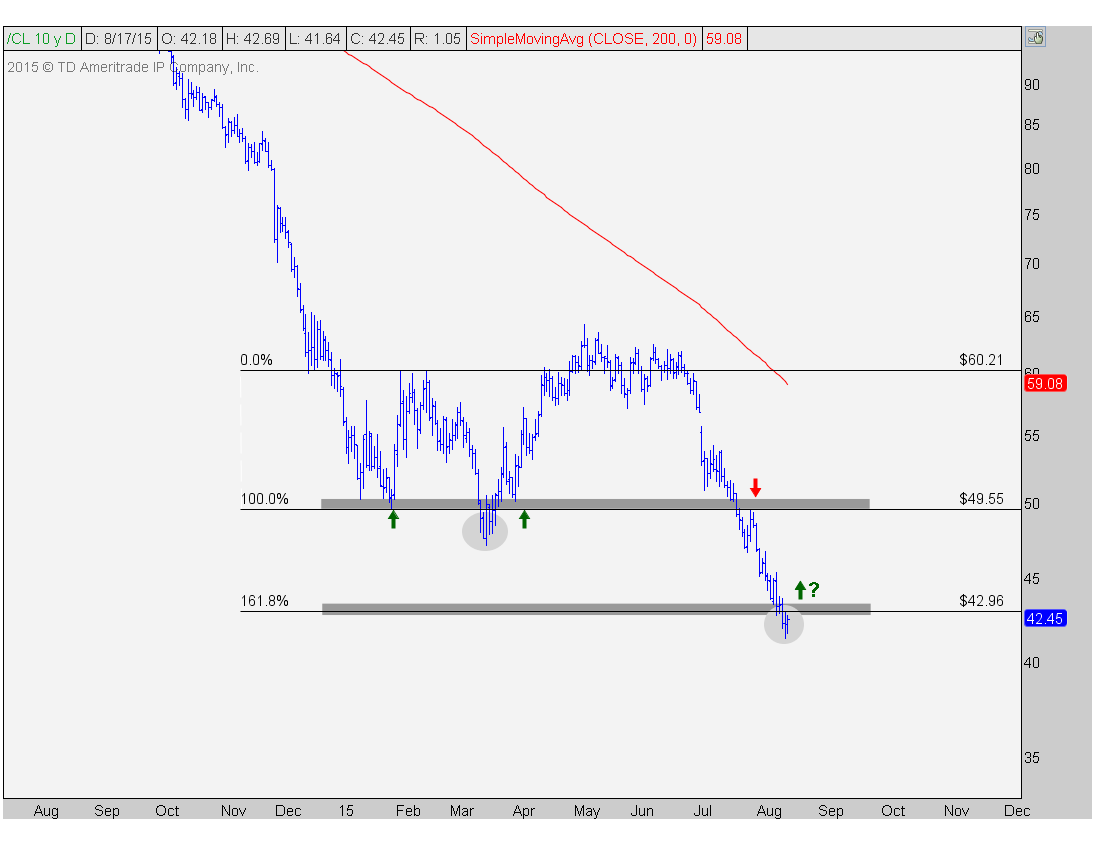 If prices are able to get back and hold above $49.50 then I can see potential for more mean reversion towards the downward sloping 200 day moving average and former support that broke in June near the high 50s. But I don’t see any sense in worrying about that at this point. I would rather wait and make those decisions if and when we ever get up there.
What do you guys think?
***
REGISTER HERE to receive weekly updates on Crude Oil using multiple timeframes as a member of Eagle Bay Solutions.

Tags: $CL_F $USO
Audio: Benzinga Morning Radio Show
Thursday morning I was on the Benzinga morning radio show chatting with the guys about the S&P500 as well as some individual stocks and commodities. I really enjoy doing this show because they like to focus on the market and price behavior, as do I. We don’t have time to be telling stories, so we focus on price, which is the only thing that pays us.
Here is the audio in full:
[soundcloud url=”https://api.soundcloud.com/tracks/204343081″ params=”auto_play=false&hide_related=false&show_comments=true&show_user=true&show_reposts=false&visual=true” width=”100%” height=”250″ iframe=”true” /]
If you enjoyed this PreMarket commentary, Click Here find out how you can receive weekly newsletters from JC and Eagle Bay Solutions.
Tags: $AAPL $SPY $ZW_F $WEAT $TLT $TNX $TSLA $PA_F $SWC $NG_F $UNG $USO $CL_F $DIS
- « Previous Page
- 1
- 2
- 3
- 4
- 5
- 6
- …
- 13
- Next Page »