“It’s a Bear Market for Bears”
Tags: $SPY $EWH $ILF $EWZ
Expert technical analysis of financial markets by JC Parets
Bull Market
Sectors are rotating….and I still think that’s what’s necessary:
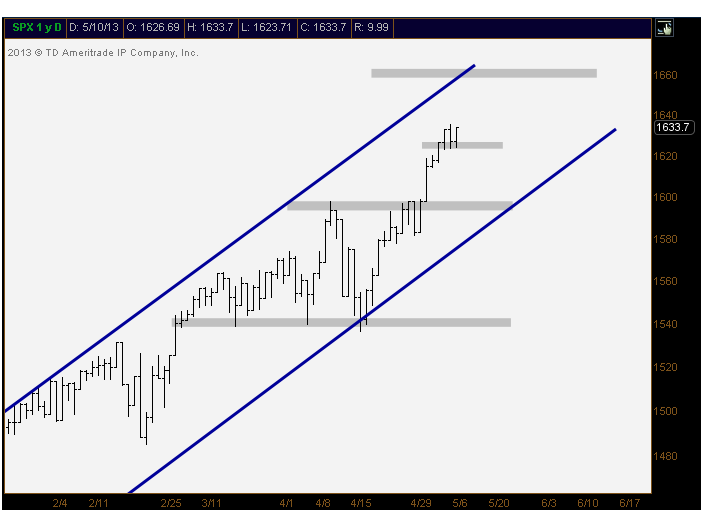
Here are some of the charts we discussed. S&P500 levels:
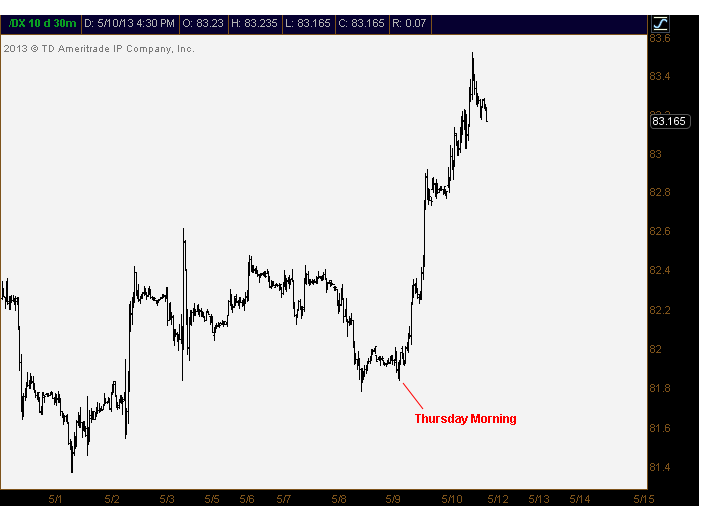
Look at what the Dollar index did the last 2 days. This is a 30-minute chart of US Dollar Index Futures:
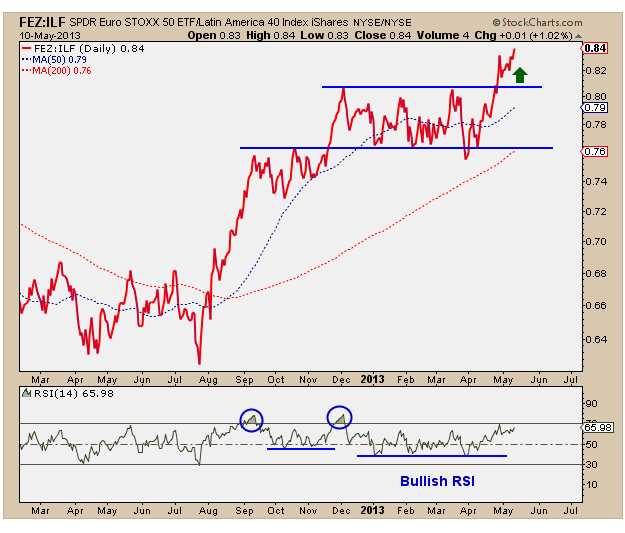
This is what the Long Europe/Short Latin America pair looks like right now:
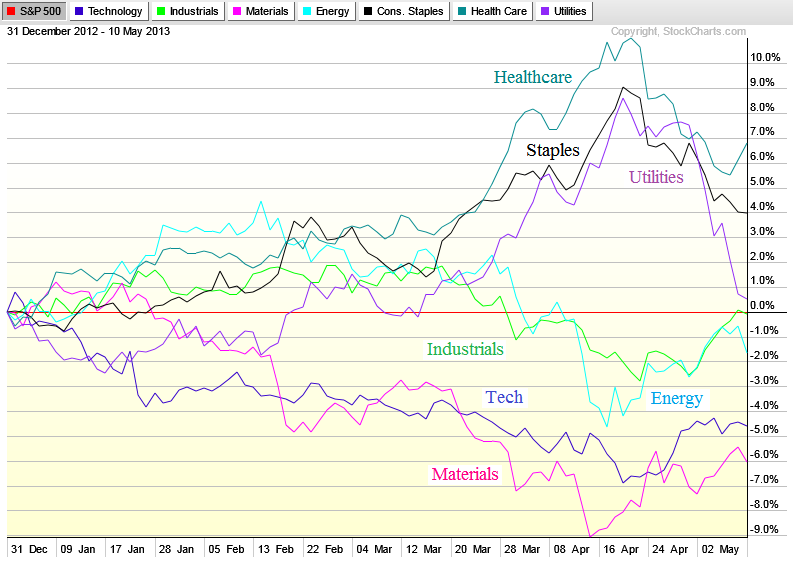
And finally the sector rotation that we keep harping on. Notice the shift in mid-April when the underperformers turned higher and the leaders rolled over. These are year-to-date numbers relative to S&Ps:
Tags: $SPY $USDJPY $TLT $FEZ $ILF $SPX $XLB $XLI $XLV $XLU
New all-time high close for the S&P500 today. So in honor of this momentous occasion, Phil and I are joined by the man, the myth, the legend himself Mr. Ryan Detrick.
We discussed Consumer Stocks, Sentiment, Treasuries, UK breakout, Coal, Latin America and Europe. Check it out:
Source:
Hanging Out With Detrick & Pearlman
Tags: $EWU $SPY $EPHE $TLT ZB_F ZN_F $TNX $ILF $FEZ $KOL
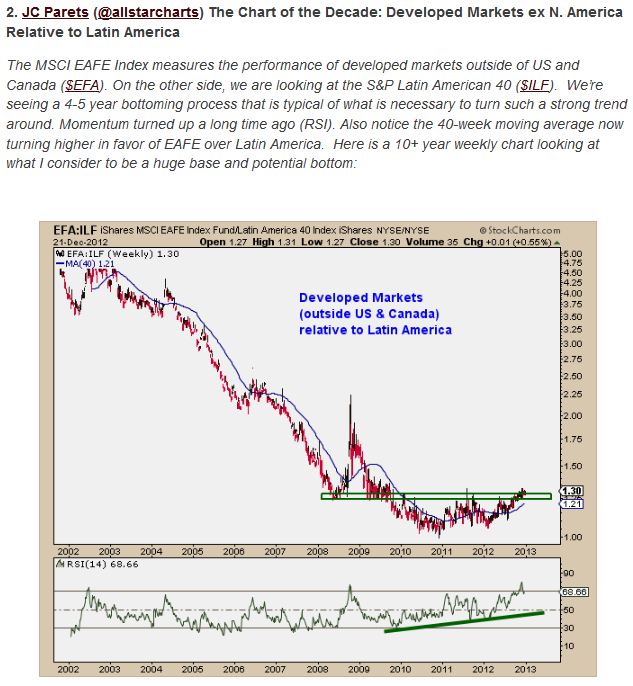
This week Stocktwits asked a group of technicians what charts they’ll be watching most closely in the year ahead. I personally still felt that the Developed Markets (outside North America) relative to Latin America is one of the most interesting things going on right now. So my chart was the $EFA/$ILF ratio that I wrote about last month:
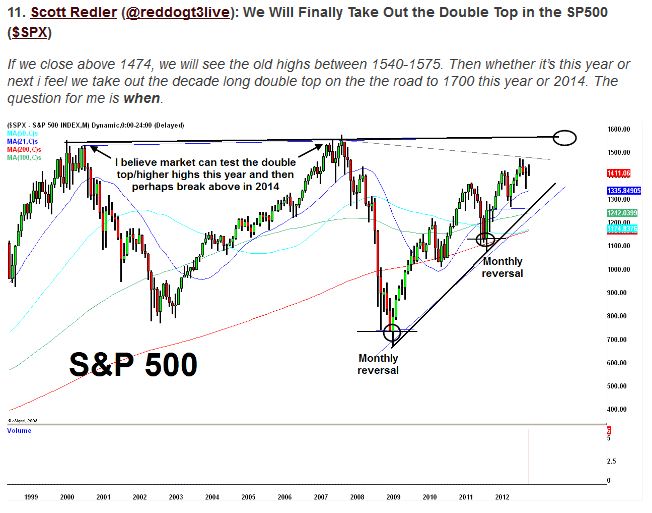
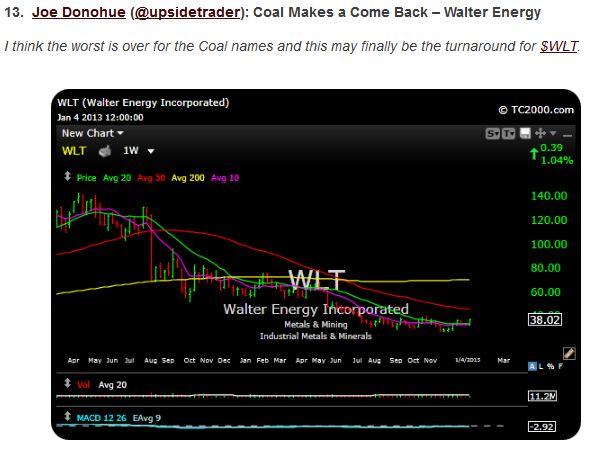
Here are a few of my favorites from the list of 15:
Check out the rest of the Charts on the Stocktwits Blog
Tags: $WLT $SPX $MDY $ILF $EFA $USDJPY $SCHW $FXY
There’s a lot to talk about these days in the charting world, both long term and short term. But today I wanted to bring up one of the more interesting transitions in money flow that I see out there. In case you didn’t know, for most of the last decade, Latin American stocks consistently outperformed much of the developed world, specifically outside of North America. But I’m pretty sure this is now changing.
The MSCI EAFE Index (Europe, Australasia and Far East) is designed to measure the performance of developed markets outside of US and Canada. There are 22 counties including Australia, Germany, France, Japan, Sweden, & UK.. On the other side, we are looking at the S&P Latin American 40, which consists of 5 major Latin American Markets: Brazil, Peru, Chile, Colombia, and Mexico.
The vehicles we’re using are iShares $EFA and iShares $ILF. Here is a 10+ year weekly chart looking at what I consider to be a huge base and potential bottom:

We’re seeing a 4-5 year bottoming process that is typical of what is necessary to turn such a strong trend around. Momentum turned up a long time ago, as we can see in the Relative Strength Index below. And also notice the 40-week moving average now turning higher in favor of EAFE over Latin America.
One of the reasons I find this chart so interesting is really because of the potential upside. We brought up Japan and Europe recently. And even though Mexico looks good on an absolute basis, it appears as though stocks in developed nations (outside north america) as a group seem poised to outperform going forward.
I hope you find this one as fascinating as I do
Source:
MSCI Global Equity Indexes (MSCI)
Tags: $EFA $ILF $EWW $EWG $EWF $EWJ