The largest insider buy on today’s list is a Form 4 filing by Charles Magro, the CEO of chemical and seed company Corteva $CTVA.
Magro reported a purchase of 40,000 shares, equivalent to $2.4 million.
Expert technical analysis of financial markets by JC Parets
The largest insider buy on today’s list is a Form 4 filing by Charles Magro, the CEO of chemical and seed company Corteva $CTVA.
Magro reported a purchase of 40,000 shares, equivalent to $2.4 million.
From the Desk of Steve Strazza @Sstrazza
When investing in the stock market, we always want to approach it as “a market of stocks.”
Regardless of the environment, there are always stocks showing leadership and trending higher.
We may have to look harder to identify them depending on current market conditions. But there are always stocks that are going up.
The same can be said for weak stocks. Regardless of the environment, there are always stocks that are going down, too.
We already have multiple scans focusing on stocks making all-time highs, such as Hall of Famers, Minor Leaguers, and the 2 to 100 Club.
We filter these universes for stocks that are exhibiting the best momentum and relative strength characteristics.
Clearly, we spend a lot of time identifying and writing about leading stocks every week, via multiple reports.
Now, we’re also highlighting lagging stocks on a recurring basis.
This is the video recording of our February 8, 2023, Inside Scoop Weekly Strategy Session.
The most significant insider buy on today’s list is a Form 4 filed by Super Micro Computer $SMCI Director Shiu Leung Chan.
Chan reported a $256,440 purchase of SMCI.
The most significant insider buy on today’s list is a Form 4 filing by New York Community Bancorp $NYCB Director Ronald A. Rosenfeld.
Rosenfeld reported a purchase of roughly $756,756 in NYCB.
From the Desk of Steve Strazza @sstrazza and Alfonso Depablos @Alfcharts
This is one of our favorite bottom-up scans: Follow the Flow.
In this note, we simply create a universe of stocks that experienced the most unusual options activity — either bullish or bearish, but not both.
We utilize options experts, both internally and through our partnership with The TradeXchange. Then, we dig through the level 2 details and do all the work upfront for our clients.
Our goal is to isolate only those options market splashes that represent levered and high-conviction, directional bets.
 We also weed out hedging activity and ensure there are no offsetting trades that either neutralize or cap the risk on these unusual options trades.
What remains is a list of stocks that large financial institutions are putting big money behind.
And they’re doing so for one reason only: because they think the stock is about to move in their direction and make them a pretty penny.
Then we flip through our list of stocks flashing unusual activity and pick the best setups using many of the same technical filters we do for our other scans.
And, just like that, we’ll follow the money flow and fatten our own pockets along with some of the world’s most powerful financial institutions.
From the desk of Steve Strazza @Sstrazza.
Welcome back to our latest Under The Hood column where we’ll cover all the action for the week ended February 3, 2023. This report is published bi-weekly and rotated on-and-off with our Minor Leaguers column.
What we do here is analyze the most popular stocks during the week and find opportunities to either join in and ride these momentum names higher, or fade the crowd and bet against them.
We use a variety of sources to generate the list of most popular names.
There are so many new data sources available that all we need to do is organize and curate them in a way that shows us exactly what we want: A list of stocks that are seeing an unusual increase in investor interest.
Watch this video for a behind the scenes look at our process.
Whether we’re measuring increasing interest based on large institutional purchases, unusual options activity, or simply our proprietary lists of trending tickers, there’s a lot of overlap.
From the desk of Steve Strazza @Sstrazza
Our Top 10 Charts Report was just published.
In this weekly note, we highlight 10 of the most important charts or themes we’re currently seeing in asset classes around the world.
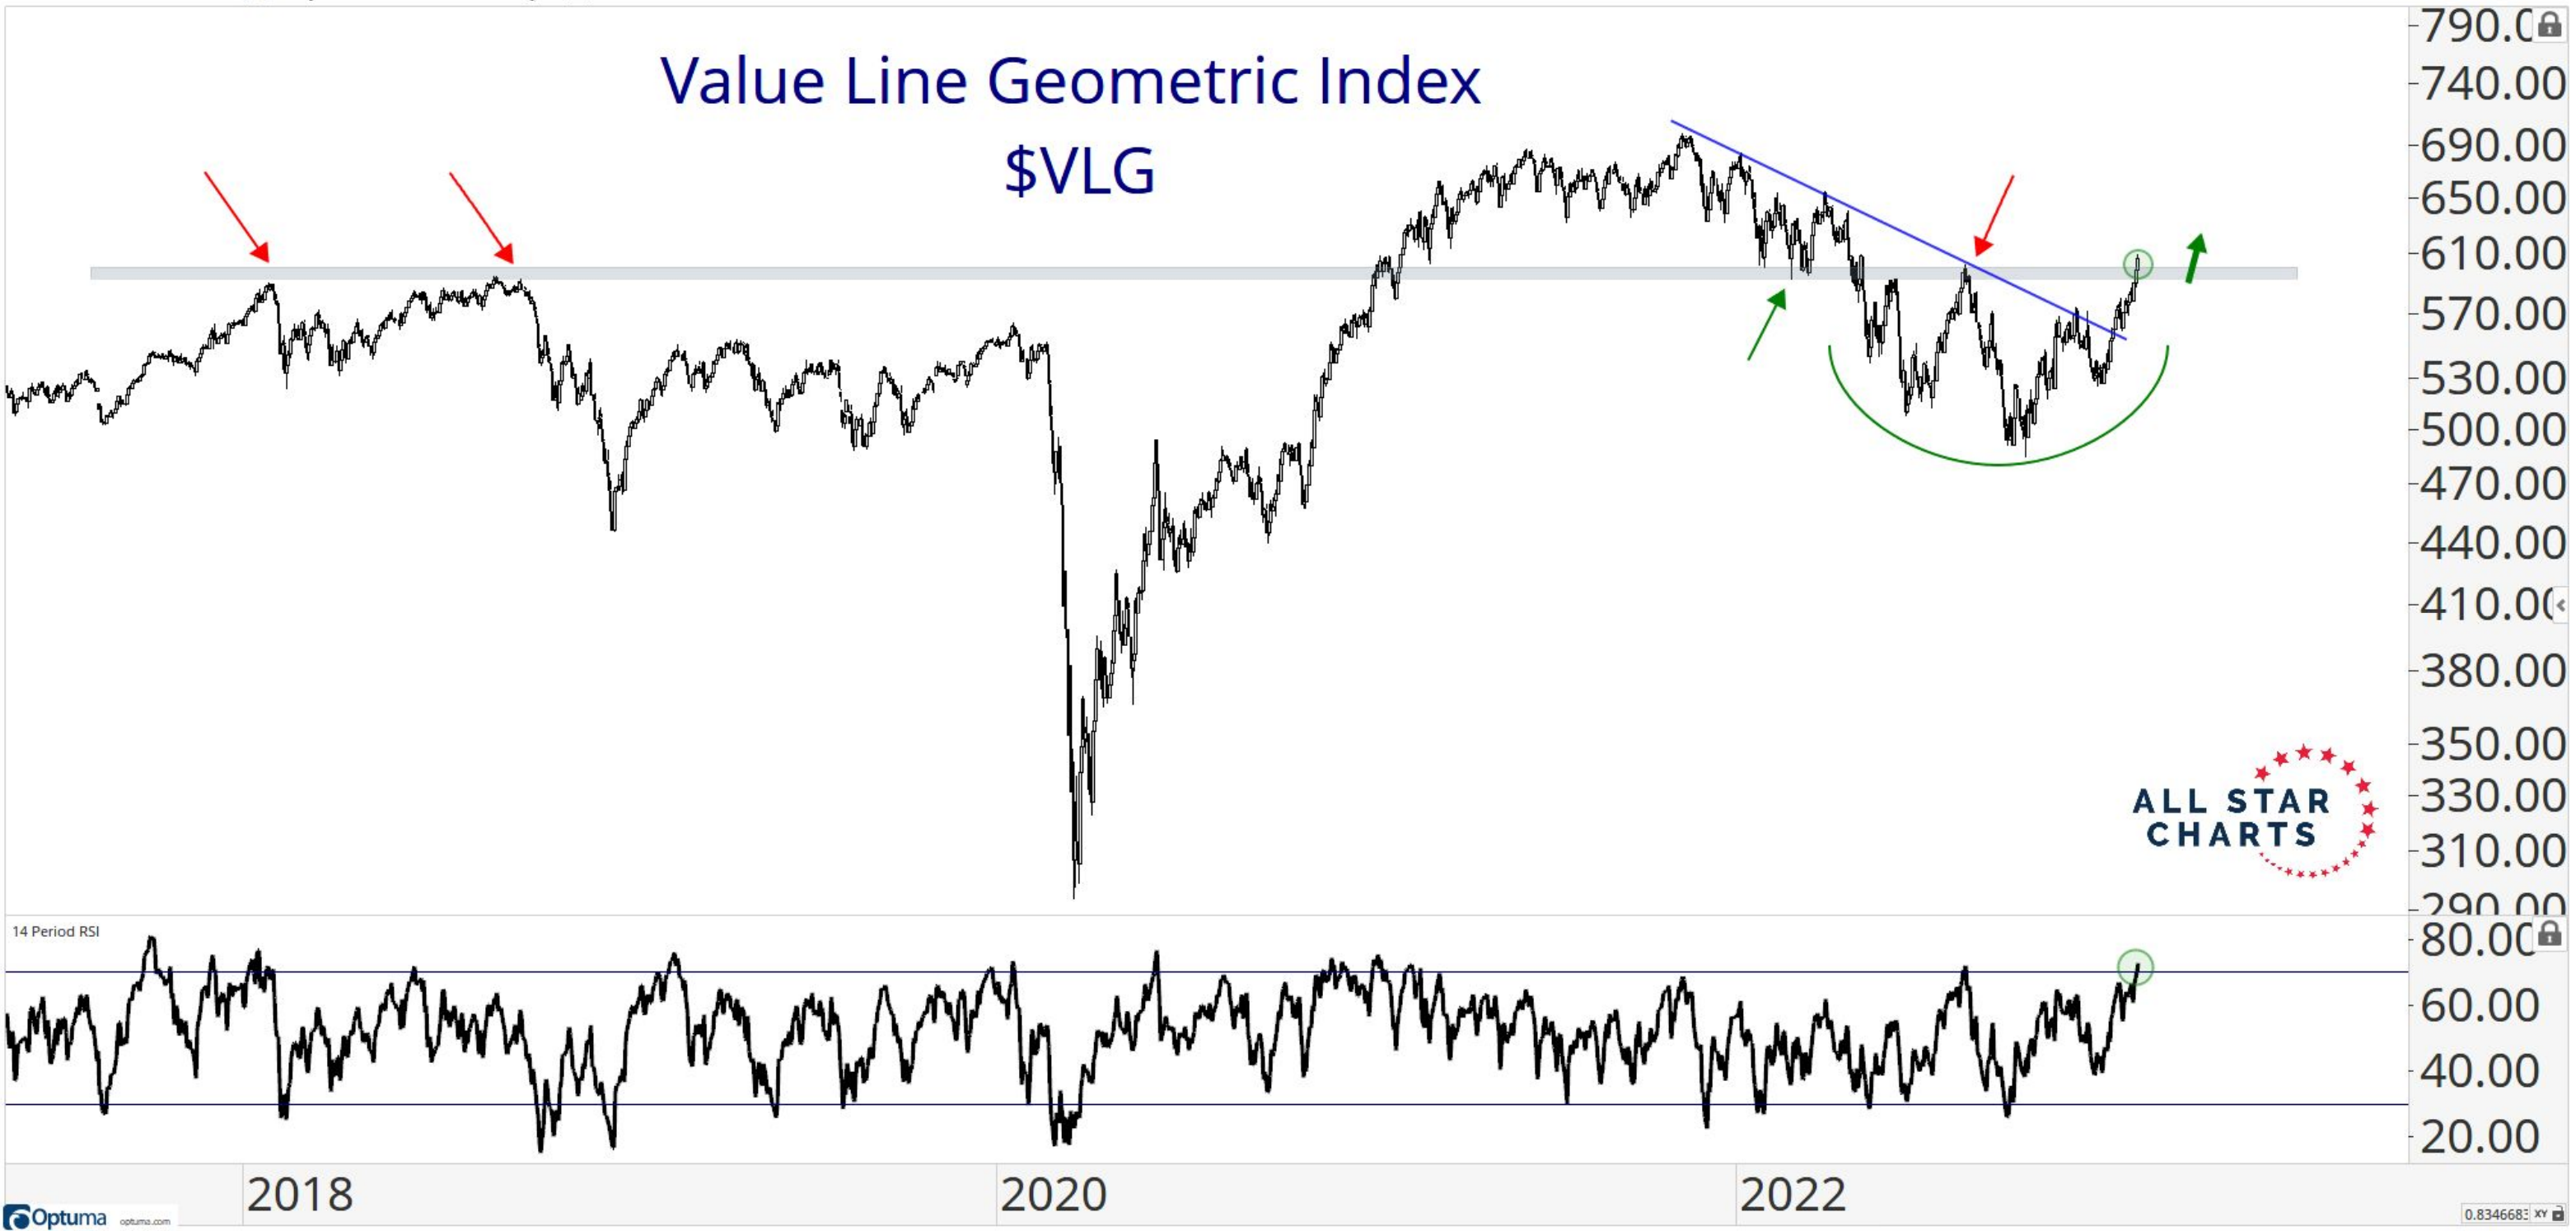
Reclaiming a Valuable Line
From an information standpoint, the Value Line Geometric Index (VLG) is one of the best tools we have at our disposal as it represents the median stock’s performance. Seeing this index make a higher high as it reclaims its prior-cycle highs from 2018 and peak from last August is a major bullish development.