It’s the weekly Gold Rush!
This week Strazza and I dig into the COT profile for Gold and Silver, revealing the sentiment behind the smart money.
Check it out… [Read more…]
Expert technical analysis of financial markets by JC Parets
It’s the weekly Gold Rush!
This week Strazza and I dig into the COT profile for Gold and Silver, revealing the sentiment behind the smart money.
Check it out… [Read more…]
From the desk of Steve Strazza @Sstrazza
Our Top 10 Charts Report was just published.
In this weekly note, we highlight 10 of the most important charts or themes we’re currently seeing in asset classes around the world.
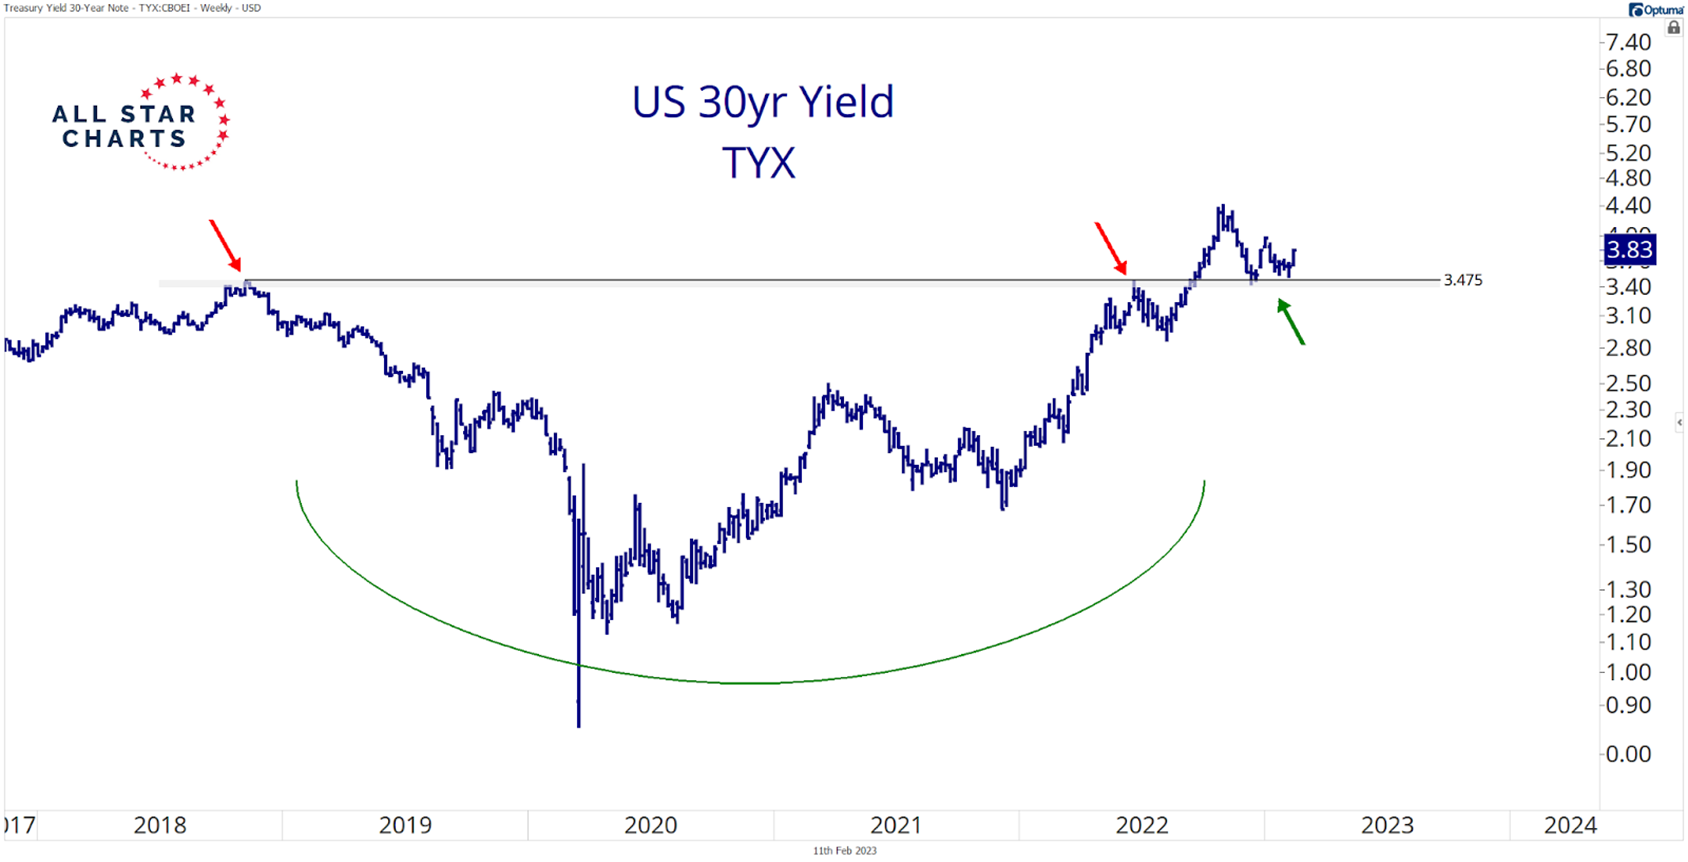
The 30yr Retests Prior Cycle Highs
The US 30yr yield refuses to break below its prior cycle highs. This is a logical level for yields to find support and churn sideways which could mean more messy action for long-duration assets such as bonds and growth stocks.
From the desk of Steve Strazza @Sstrazza
Check out this week’s Momentum Report, our weekly summation of all the major indexes at a Macro, International, Sector, and Industry Group level.
By analyzing the short-term data in these reports, we get a more tactical view of the current state of markets. This information then helps us put near-term developments into the big picture context and provides insights regarding the structural trends at play.
Let’s jump right into it with some of the major takeaways from this week’s report:
* ASC Plus Members can access the Momentum Report by clicking the link at the bottom of this post.
From the Desk of Steve Strazza @sstrazza and Alfonso Depablos @Alfcharts
This is one of our favorite bottom-up scans: Follow the Flow.
In this note, we simply create a universe of stocks that experienced the most unusual options activity — either bullish or bearish, but not both.
We utilize options experts, both internally and through our partnership with The TradeXchange. Then, we dig through the level 2 details and do all the work upfront for our clients.
Our goal is to isolate only those options market splashes that represent levered and high-conviction, directional bets.
 We also weed out hedging activity and ensure there are no offsetting trades that either neutralize or cap the risk on these unusual options trades.
What remains is a list of stocks that large financial institutions are putting big money behind.
And they’re doing so for one reason only: because they think the stock is about to move in their direction and make them a pretty penny.
Then we flip through our list of stocks flashing unusual activity and pick the best setups using many of the same technical filters we do for our other scans.
And, just like that, we’ll follow the money flow and fatten our own pockets along with some of the world’s most powerful financial institutions.
Cathie Wood’s ARK Investment Management is on our list today, as it just filed amended 13Gs for Roku Inc $ROKU and Cerus Corporation $CERS.
The asset manager reported a small increase in its ownership of ROKU, from 9.94% to 10.12%.
For its CERS position, it revealed a stake of 10.11%, up from the 8.94% previously reported.
From the desk of Steve Strazza @Sstrazza and Alfonso Depablos @AlfCharts
Our Hall of Famers list is composed of the 150 largest US-based stocks.
These stocks range from the mega-cap growth behemoths like Apple and Microsoft – with market caps in excess of $2T – to some of the new-age large-cap disruptors such as Moderna, Square, and Snap.
It has all the big names and more.
It doesn’t include ADRs or any stock not domiciled in the US. But don’t worry; we developed a separate universe for that which you can check out here.
The Hall of Famers is simple.
We take our list of 150 names and then apply our technical filters so the strongest stocks with the most momentum rise to the top.
Let’s dive right in and check out what these big boys are up to.
The largest insider buy on today’s list comes in a Form 4 filing by Bryant R. Riley, the chairman and CEO of B. Riley Financial $RILY.
Riley reported a purchase of $5.4 million worth of RILY stock.
From the Desk of Steve Strazza @Sstrazza
As our Premium Members already know, we have a laundry list of scans that we run internally on an almost daily basis.
Different market environments, naturally, are more conducive to certain scans and less so to others.
We think our Freshly Squeezed scan is perfect for the current market. In fact, we wrote our initial report in December just to be sure we wouldn’t miss the moves that have taken place in recent weeks. We’re confident there is more to come.
With so many individual issues in massive drawdowns as the broader market begins to turn a corner, we’re witnessing some serious short-covering rallies in some of the most beaten-down names.
In fact, it’s already starting to happen. Bed, Bath & Beyond $BBBY was up by almost 100% the other day. It’s very likely they’re going bankrupt. But that’s just the kind of market we’re in.
Our scan is quite simple. It is designed to identify stocks with the highest short positions. When a stock is heavily shorted, we know there are incremental buyers waiting in the wings.
We love this as new buyers are the one true catalyst for higher prices. When shorts are proven wrong, they have to buy their shares back to close out their positions. And when they do, and momentum starts moving higher in these shorted names, it is not uncommon for massive rallies to occur.
For this reason, we pair short-interest data with short-term momentum overlays, as this is the match that is needed to spark a squeeze.
Let’s take a look at what’s popping up on our radar right now and outline setups in some stocks we think investors can squeeze profits out of in the weeks and months ahead.
We’ll also give an update on some of our long ideas from December’s report.