H Partners Management filed a Form 4 reporting the purchase of roughly $4.6 million in the theme parks corporation Six Flags Entertainment $SIX.
The hedge fund now has a total stake in SIX of more than 11.50%.
Expert technical analysis of financial markets by JC Parets
H Partners Management filed a Form 4 reporting the purchase of roughly $4.6 million in the theme parks corporation Six Flags Entertainment $SIX.
The hedge fund now has a total stake in SIX of more than 11.50%.
From the Desk of Steve Strazza @Sstrazza
Welcome to the 2 to 100 Club.
As many of you know, something we’ve been working on internally is using various bottom-up tools and scans to complement our top-down approach. It’s really been working for us!
One way we’re doing this is by identifying the strongest growth stocks as they climb the market-cap ladder from small- to mid- to large- and, ultimately, to mega-cap status (over $200B).
Once they graduate from small-cap to mid-cap status (over $2B), they come on our radar. Likewise, when they surpass the roughly $30B mark, they roll off our list.
But the scan doesn’t just end there.
We only want to look at the strongest growth industries in the market, as that is typically where these potential 50-baggers come from.
Some of the best performers in recent decades – stocks like Priceline, Amazon, Netflix, Salesforce, and myriad others – would have been on this list at some point during their journey to becoming the market behemoths they are today.
When you look at the stocks in our table, you’ll notice we’re only focused on Technology and Growth industry groups such as Software, Semiconductors, Online Retail, Solar, etc.
Then, like any good technician, we filter the list down to those closest to new highs.
This allows the cream of these strong groups to rise to the top and helps streamline our mission to identify technical breakouts in the top-performing stocks.
The largest insider transaction on today’s list is a Form 4 filing by Sameer Gandhi, a director at Freshworks $FRSH.
Gandhi reported a purchase of FRSH stock worth $11.5 million.
The most significant insider activity on today’s list comes in a Form 4 filing by Kelcy Warren, the executive chairman of Energy Transfer $ET.
Warren reported a purchase worth roughly $29.2 million.
From the Desk of Steve Strazza @Sstrazza
Welcome to our latest Minor Leaguers report.
We’ve had some great trades come out of this small-cap-focused column since we launched it back in 2020 and started rotating it with our flagship bottom-up scan, Under the Hood.
For the first year or so, we focused only on Russell 2000 stocks with a market cap between $1 and $2B.
That was fun, but we wanted to branch out a bit and allow some new stocks to find their way onto our list.
We expanded our universe to include some mid-caps.
To make the cut for our Minor Leaguers list, a company must have a market cap between $1 and $4B.
And it doesn’t have to be a Russell component — it can be any US-listed equity. With participation expanding around the globe, we want all those ADRs in our universe.
The same price and liquidity filters are applied. Then, as always, we sort by proximity to new highs in order to focus on the best players.
But, instead of all-time highs, we’re sorting by 52-week highs these days, as we don’t want to discriminate against energy or other cyclical stocks.
The goal is still to catch the strongest names while they’re small and have serious upside potential. If any of these stocks ever climb the ranks to the big leagues, the returns could be huge.
We’re looking at up to 10x moves just to break into large-cap land!
Let’s dive into this week’s report and see what’s happening in some of the hottest stocks in the Minor Leagues.
From the Desk of Steve Strazza @sstrazza
This is one of our favorite bottom-up scans: Follow the Flow.
In this note, we simply create a universe of stocks that experienced the most unusual options activity — either bullish or bearish, but not both.
We utilize options experts, both internally and through our partnership with The TradeXchange. Then, we dig through the level 2 details and do all the work upfront for our clients.
Our goal is to isolate only those options market splashes that represent levered and high-conviction, directional bets.
 We also weed out hedging activity and ensure there are no offsetting trades that either neutralize or cap the risk on these unusual options trades.
What remains is a list of stocks that large financial institutions are putting big money behind.
And they’re doing so for one reason only: because they think the stock is about to move in their direction and make them a pretty penny.
Then we flip through our list of stocks flashing unusual activity and pick the best setups using many of the same technical filters we do for our other scans.
And, just like that, we’ll follow the money flow and fatten our own pockets along with some of the world’s most powerful financial institutions.
From the desk of Steve Strazza @Sstrazza
Our Top 10 Charts Report was just published.
In this weekly note, we highlight 10 of the most important charts or themes we’re currently seeing in asset classes around the world.
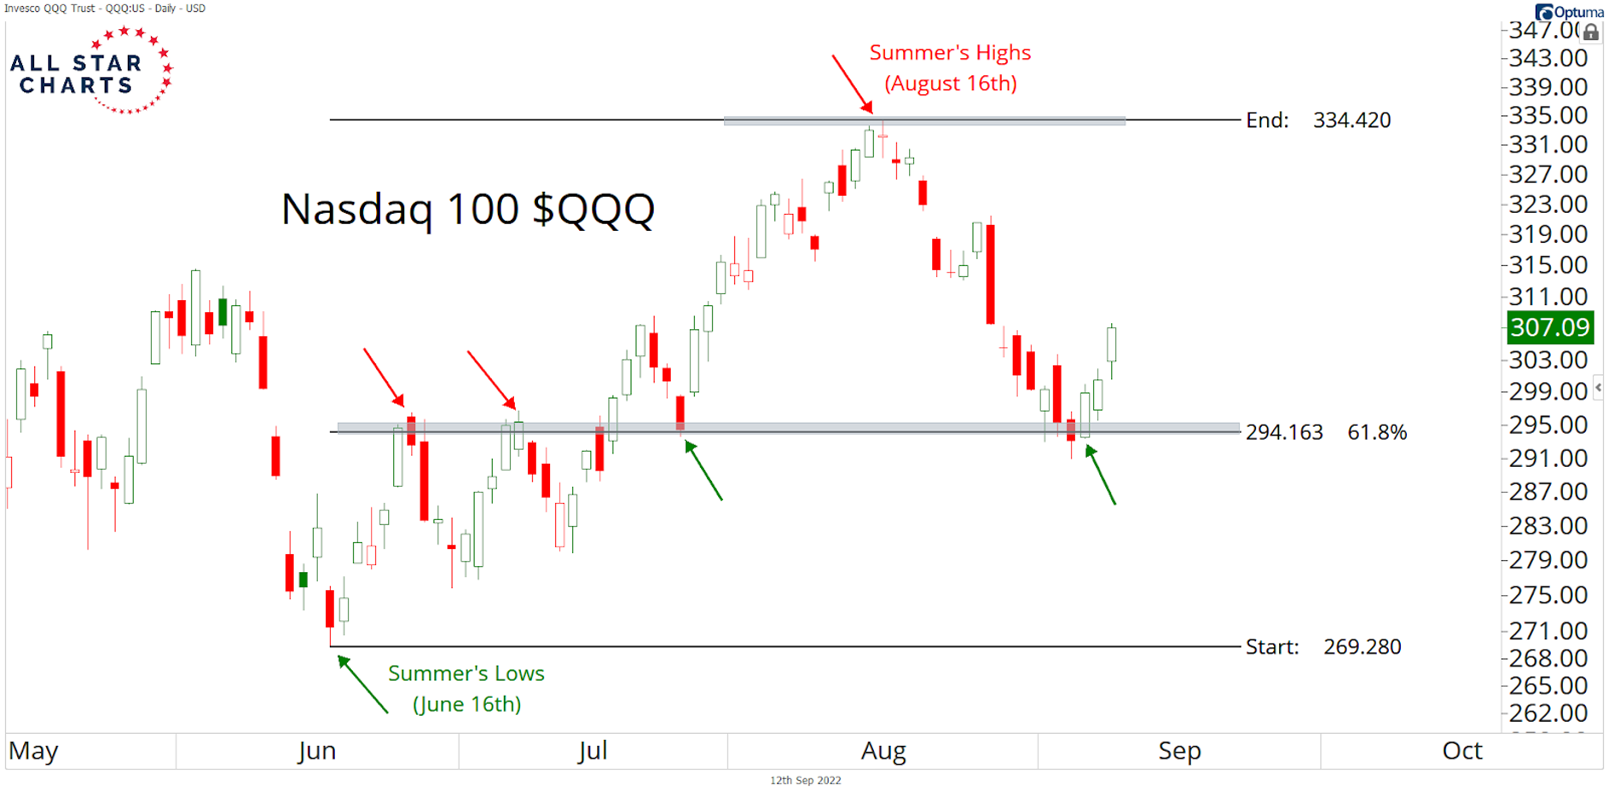
Finding Support with Fibonacci
US equities appear to be regaining ground after giving back some of their gains from this summer. Following the corrective action of the last few weeks, the Nasdaq 100 ETF has finally found support at the 61.8% Fibonacci retracement level of the June-to-August advance. These levels represent a logical place for demand to show up and halt prices from falling further. We’re watching closely to see what kind of follow-through we get in the coming days. If this was really the bottom, we should see a higher high in the near future. On the other hand, a break below 294 would signal increased downside risk and likely lead to a retest of the June lows. From a tactical standpoint, this is our line in the sand for the Nasdaq 100.
From the desk of Steve Strazza @Sstrazza
Check out this week’s Momentum Report, our weekly summation of all the major indexes at a Macro, International, Sector, and Industry Group level.
By analyzing the short-term data in these reports, we get a more tactical view of the current state of markets. This information then helps us put near-term developments into the big picture context and provides insights regarding the structural trends at play.
Let’s jump right into it with some of the major takeaways from this week’s report:
* ASC Plus Members can access the Momentum Report by clicking the link at the bottom of this post.