From the desk of Tom Bruni @BruniCharting
Although most market participants are fixated on the gyrating US equity markets or Italian bond yields, two trade setups have formed elsewhere in the currency markets.
Expert technical analysis of financial markets by JC Parets
From the desk of Tom Bruni @BruniCharting
Although most market participants are fixated on the gyrating US equity markets or Italian bond yields, two trade setups have formed elsewhere in the currency markets.
From the desk of Tom Bruni @BruniCharting
Every now and then I use mystery charts to source people’s raw opinions and challenge my own thinking. Not knowing what a chart represents helps eliminate biases and any ideas we may already have in our heads. And so today I’m back, selfishly, looking for thoughts on the chart below.
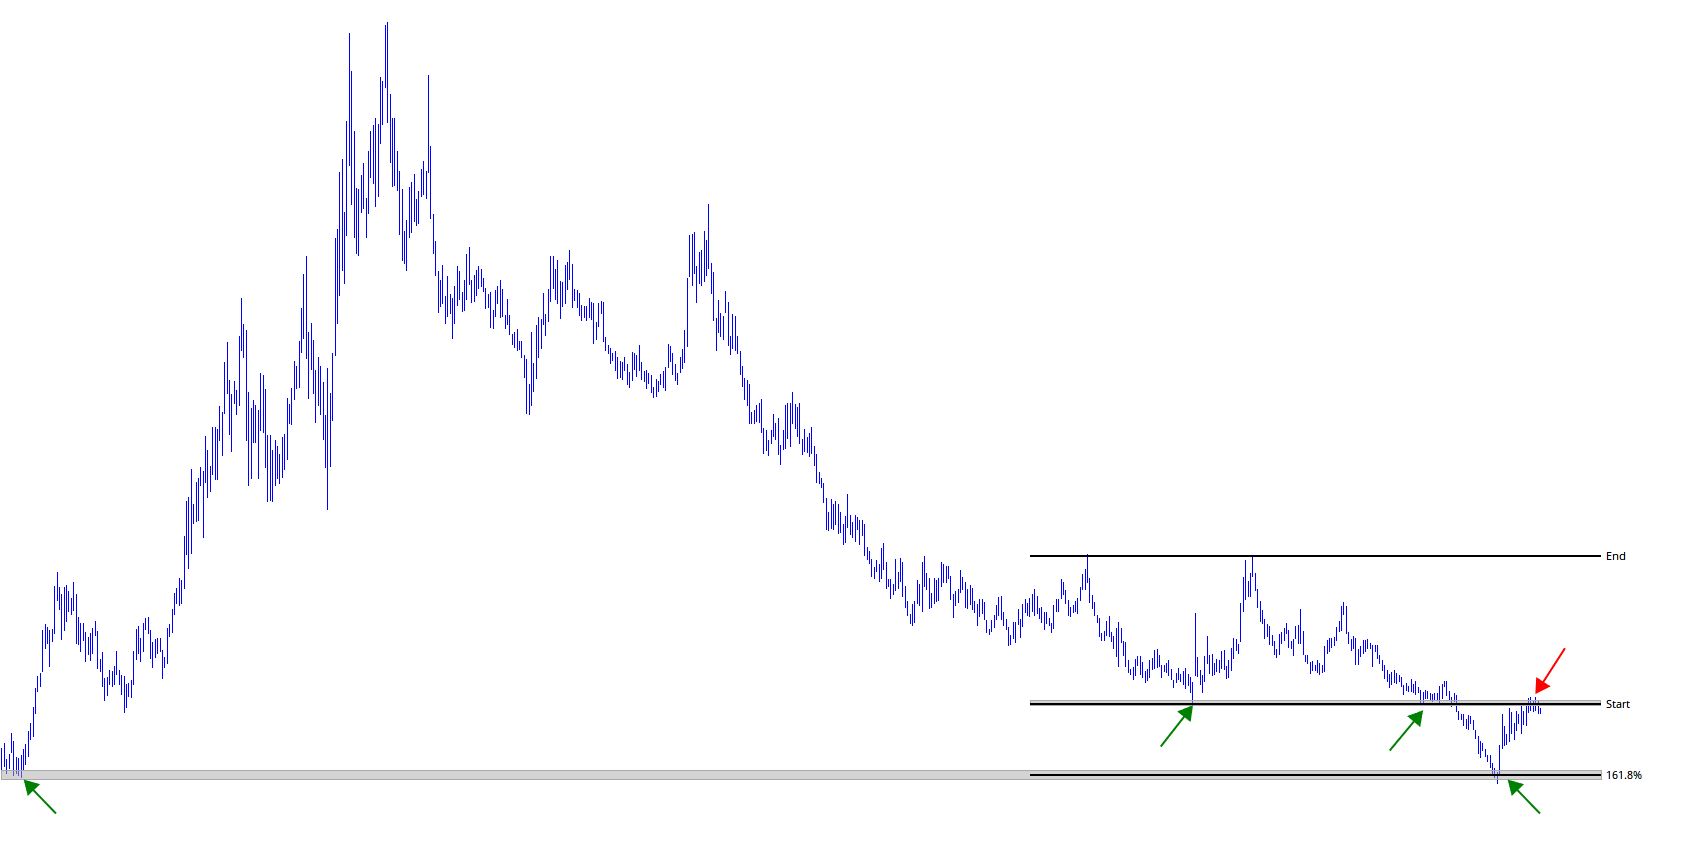
Click on chart to enlarge view. [Read more…]
From the desk of Tom Bruni @BruniCharting
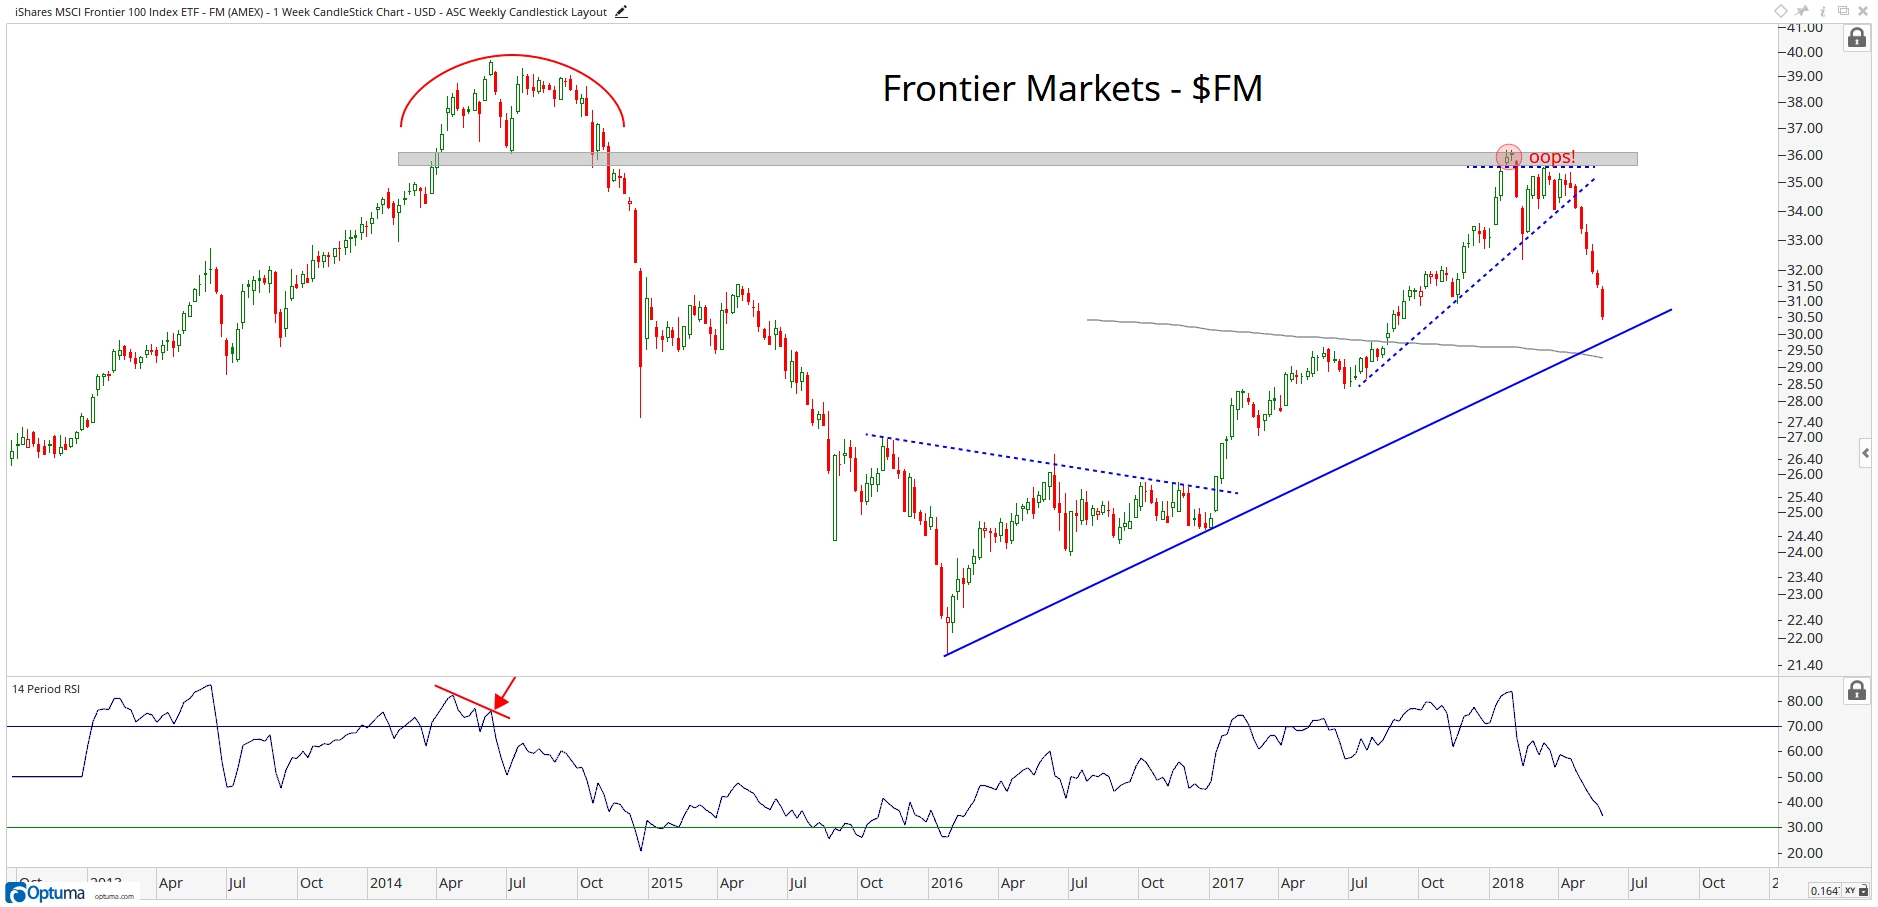
The US Dollar Index is up roughly 7.5% since it’s February lows, a move that has hit many of the global stock market ETFs we follow due to their local currency exposure. The Frontier Markets ETF $FM is among those hit hardest, down roughly 16% since late January. With that in mind, we like to focus on strength and there are three global ETFs that continue to hold up well and should lead if/when strength in the US Dollar subsides.
 Click on chart to enlarge view.
From the desk of Tom Bruni @BruniCharting
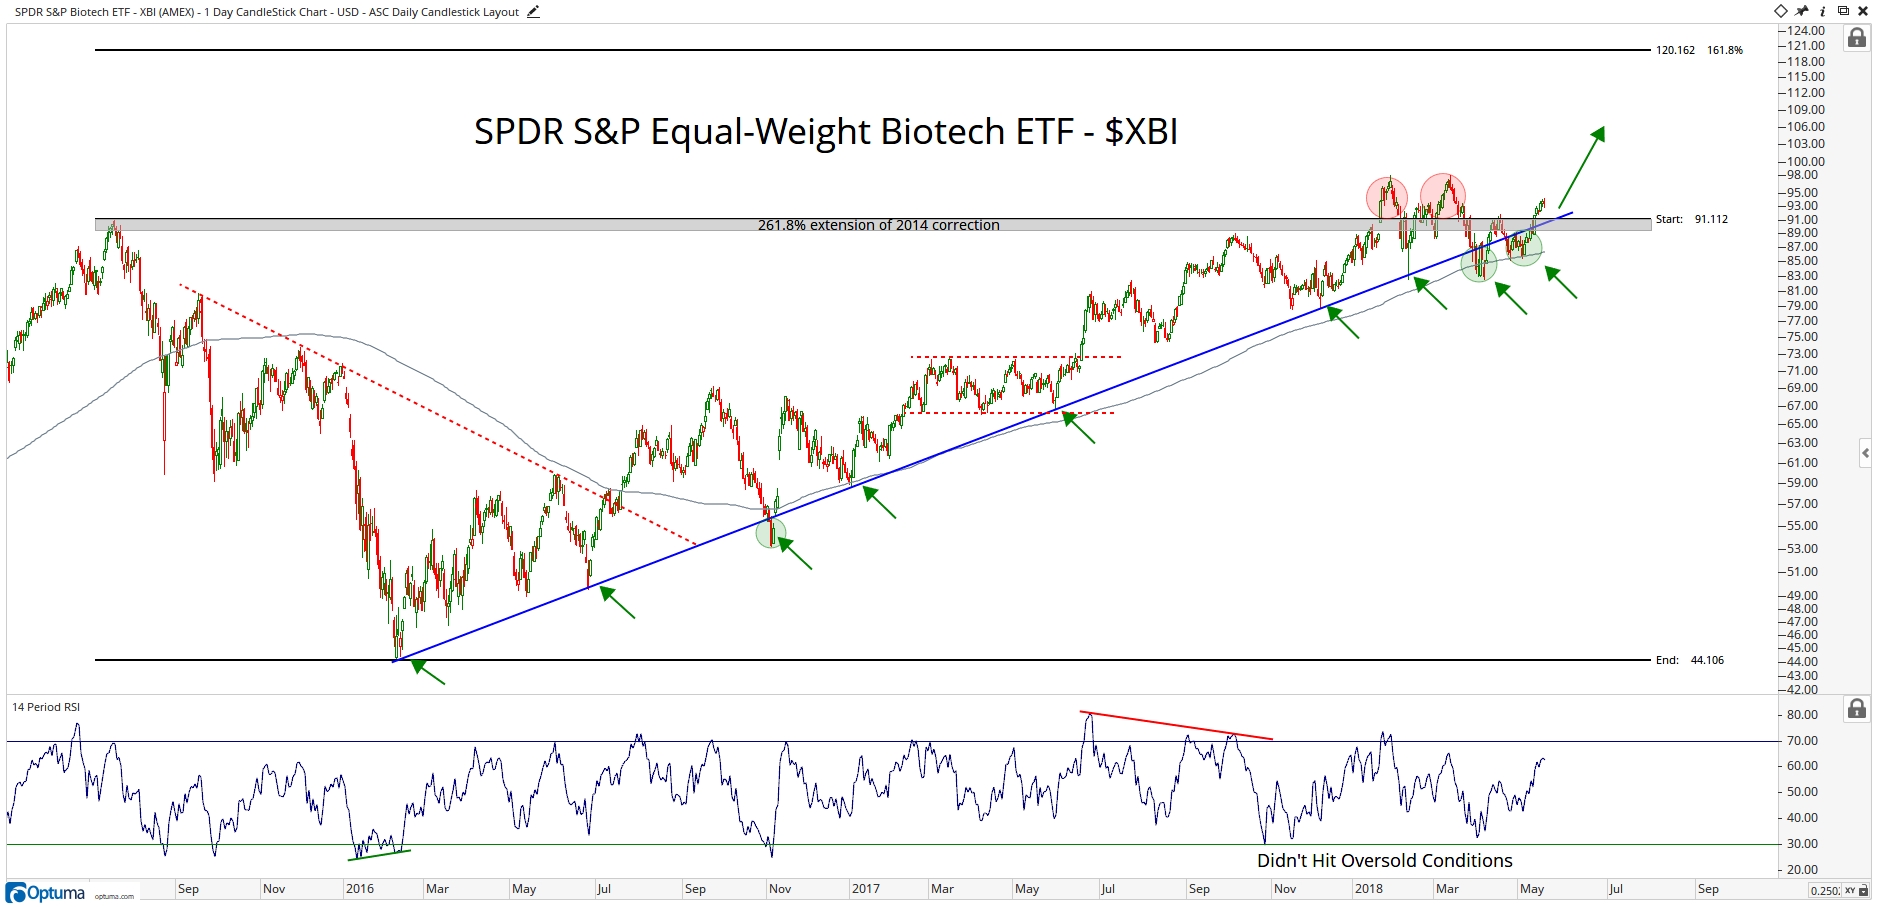
If you’ve been reading our content over these last few weeks, you’ve likely noticed we’ve been performing a lot of deep dives on the sectors we want to be involved in on the long side like Solar, Energy (premium), Retail, and Software (premium). Healthcare in general has been a laggard and the Medical Device space continues to lead, but now we’re seeing Biotechnology start to break out as well. In this post we’re focused on the equal-weighted Biotech ETF $XBI, as the cap-weighted $IBB is lagging significantly and remains weak. This out-performance by the equal-weight sector ETF signifies a broad-based rally is underway, so we’re looking for the best names in the sector to take advantage of this theme.
As the daily chart below shows, the XBI has tried several times over the last six months to clear resistance at its 2015 highs of 91. It’s failed to hold this breakout twice before, but is taking another shot at it. The fact that the broader market has found its footing again should be a decent tailwind for this trend to accelerate and confirm a successful breakout. Our 120 price target for this breakout is approximately 30% above current levels, so in the rest of this post we’ll be looking at some individual names that look poised to lead this sector higher.
Click on chart to enlarge view.
[Read more…]
From the desk of Tom Bruni @BruniCharting
It’s been a rainy week here in New York, however, the Solar sector ETF $TAN was a bright spot as it broke out of a 2.5-year base. As a result, we’ve done a deep dive into the sector to identify several names that look to be offering asymmetric reward/risk opportunities on the long side.
From the desk of Tom Bruni
I know you’re probably tired of hearing this intro over and over again, but to start this post I want to reaffirm that at Allstarcharts we remain in the camp that stocks in the U.S. and globally are headed higher. Normally we focus on the sectors that are leading and making new all-time highs, however, the Oil & Gas Exploration & Production ETF $XOP is breaking out of a multi-year consolidation, signaling a new intermediate or long-term uptrend is beginning. As a result, we want to see which names in this space present the best reward/risk scenarios to take advantage of this thesis. [Read more…]
From the desk of Tom Bruni
Since the market’s volatility picked up in late January, one key piece of the bear thesis has been weakness in Technology, yet we’ve not seen a crack and flush lower. I don’t know about you, but I was promised a “Tech Wreck” and will not leave until we get one or Mr. Market provides me a refund.
Okay I’m being facetious, but in this post I want to outline what I’m watching and explore what the implications are if the potential bearish patterns in this sector don’t pan out.
From the desk of Tom Bruni
Many have fixated their attention on the “triangle pattern” that’s formed the NYSE Composite Index and other major US indices. This pattern is a visual representation of the indecision between buyers and sellers in the market, and its resolution typically leads to a significant move in the direction of its breakout. In times like this where the index itself has little directional conviction, a study of the components may offer some insight into which way the market resolves. [Read more…]