Here is the video in full:
Source:
Business Day: Technical Tuesdays (BNN)
Tags: $CRB $DX_F $SPY $SPX $UUP $GC_F $GLD $TLT $TNX $ZB_F
Expert technical analysis of financial markets by JC Parets
Here is the video in full:
Source:
Business Day: Technical Tuesdays (BNN)
Tags: $CRB $DX_F $SPY $SPX $UUP $GC_F $GLD $TLT $TNX $ZB_F
The worst performing month of 2013 is now in the books. Funny enough, the S&P500 only lost 3%. But the internals and breadth in this market have been deteriorating for some time. We’ve pointed to several examples of this over the past 4-5 weeks, so today we reviewed some of that. Also bonds this week confirmed everything we discussed in last week’s video. They look great and everyone still hates them. And finally since it’s the end of the month, we took a look at the Dow Jones Industrial Average going back 20 years. And it looks like we’re up in the nosebleed section.
I hope you enjoy the video:
Tags: $DJI $DJIA $DIA $SPX $SPY $ES_F $TLT $TNX $ZB_F $CRB $DJP
A funny thing happened on Monday afternoon. As stocks rolled over into the close, US Treasury Bonds didn’t follow. This is now something different, a change in character for these markets. Last Friday we ran the numbers: Stocks and Bonds ($SPY & $TLT) had a 1-week positive correlation of +0.95, a 2-week correlation of +0.94 and a 1-month +0.79. The results showed a very high positive correlation between the two asset classes. Interest rates rising was bad for stocks and bonds. But no more.
I was pretty vocal on Stocktwits Monday about this shift in market behavior. But since this has now continued into Tuesday, I think it’s worth a quick blog post. Lower rates are now negative for stocks.
Here is a 10-minute chart showing the close relationship between the two asset classes. They came apart around 2 o’clock Monday:
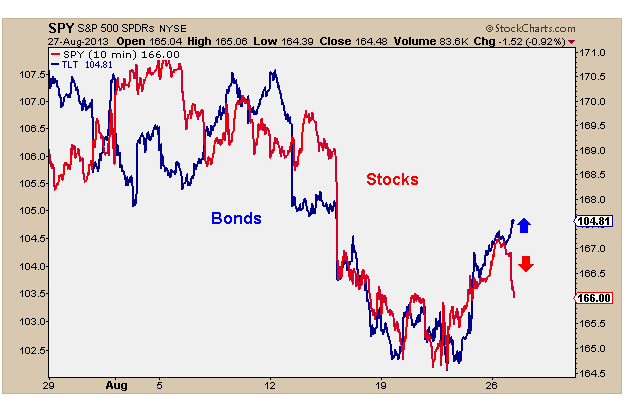 With stocks selling off, it seems as though the market is looking for the safety of US Treasury Bonds. Safety appears to be the priority, not the fear of higher rates. This is an interesting development.
I’ll follow up as this behavior continues. I think this is just the beginning of the return of negative correlations.
Tags: $TLT $SPY $ZB_F $ZN_F $TNX $SPX $ES_F
We had a lot to cover this week. And although this may be a boring few days coming up, there are some interesting setups that could start to get going. First of all, everyone hates bonds so I think that’s something to pay attention to. But we also discussed Herbalife, Vietnam, S&Ps and the importance of keeping an open mind as a market participant.
Enjoy:
Tags: $SPY $DJIA $DIA $SPX $HLF $VNM $TLT $ZB_F $TNX
Summer is almost over boys and girls. There’s only one more week before September gets going. So as we enter the last few days of the season, I believe it’s prudent to think about what’s coming up next. How can we be best prepared for September? Well, I think now is probably as good a time as any to check the seasonality stats as we head into Labor Day.
This chart below shows the average monthly performance going back to the beginning of the Dow Jones Industrial Average in 1886. There’s one month in particular that really stands out:
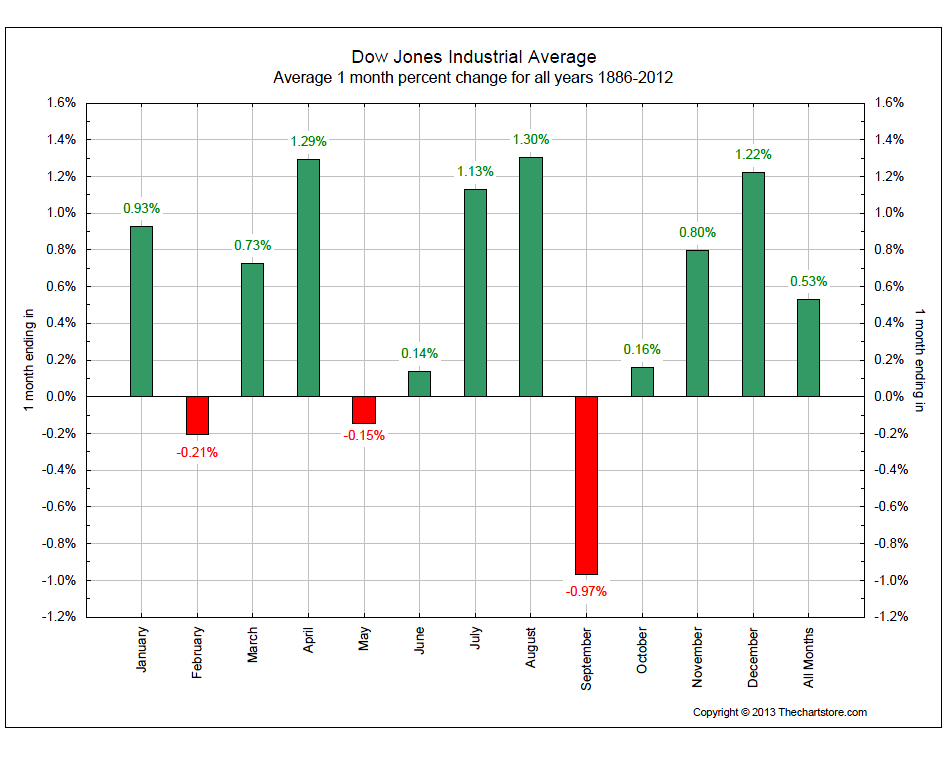
There isn’t much for me to say here. The numbers speak for themselves.
This chart represents every single year. Check out the Presidential Cycle that was posted last week to see what the end of post-election years typically look like.
Source:
Seasonal Patterns For Dow (TheChartStore)
Tags: $DJIA $DIA $SPX $SPY
There is a common misconception out there that, “gaps are always filled”. We’ve all heard that one right? But the thing is, that there are all different kinds of gaps that all have different implications. Exhaustion Gaps for example are always filled, by definition. They show up at the end of a move, uptrend or downtrend, and then quickly reverse. It was given that name because the market’s move by that point is, “exhausted”. But Breakaway Gaps aren’t filled for a long time, if ever. They show up to begin a big move. One day the market gaps higher (or lower in a new downtrend) and doesn’t look back. Some might call it a “gap and go”.
Take a look at all of these gap and go’s in the stock market during this uptrend. Nice moves followed those gaps. But this is now the second consecutive time that we’ve seen one to the downside. So if this is indeed a breakaway gap, the implications could be devastating for this market.
We at least know this isn’t an exhaustion gap….
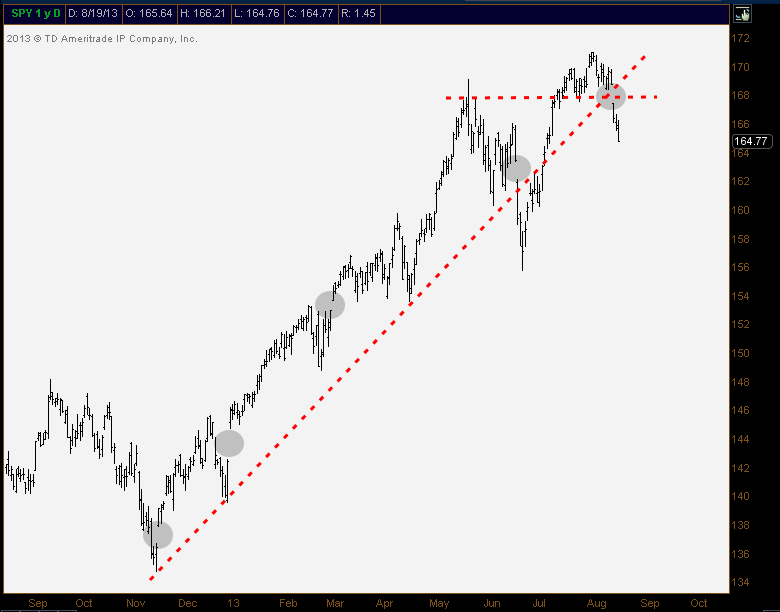
Look at the uptrend line from the November lows. These recent gaps lower came at or around that trendline. So we know the market is recognizing the significance of this well-defined uptrend. Now we’re back below it, after gapping lower. This critical break also comes right at the horizontal support we’ve been talking about, that represents the May closing highs.
Breakaway gap or not, this is an important series of events that has occurred over the last week. To invalidate the consequences of this potential breakaway gap, S&Ps quickly need to be fill it and the May highs need to be retaken by the bulls.
The Japanese call gaps, “windows”. And when they’re filled, they say the market is “closing the window”. So with that in mind, I think the bulls’ window of opportunity could be closing as we speak.
Tags: $SPY $SPX $ES_F
The momentum divergences have been building up. Less stocks on the NYSE have been making new highs as prices head higher. On the most recent highs this month, less stocks in the S&P500 were able to make it above their 200 day moving average. And seasonality is just not on the side of the bulls right now.
These were all warning signs. But they are supplementary indicators to the all important price action. The divergences gave us a heads up that something smelled fishy, but it wasn’t until prices broke down last week that we could really start leaning bearish. Today we’re looking at what I think are the important levels in the S&P500.
The big break, in my opinion, was the 1670 level that represented the July 16th lows as well as the May closing highs. A break below that meant that the bulls were unable to hold on to the new recovery highs. When new highs are just temporarily made before failing quickly, it could be a recipe for disaster. And that’s precisely the predicament that S&Ps find themselves in as we start the new week: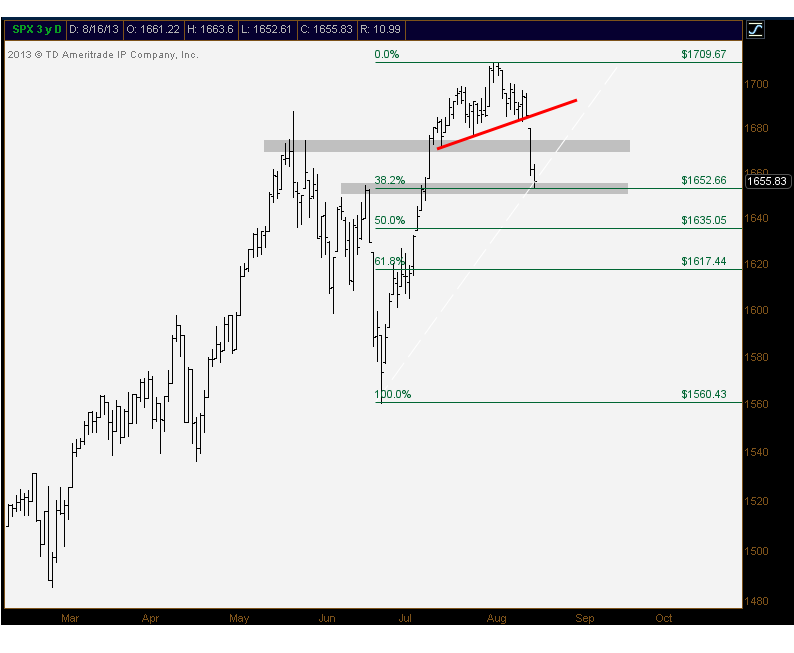
Now, last week the S&P500 settled right near the mid-June highs which also represents the 38.2% Fibonacci retracement from the June lows to the early August highs. How reliable is this support? Eh, it’s something I guess. And the 50 day moving average is right here, which is making a lot of headlines these days.
If this level can’t hold, which I’m thinking it won’t, there is some churning that took place just before 4th of July weekend. This level coincides with the 61.8% fib retracement and is probably the last level the bulls have. If they can’t defend those late June/early July lows, then a retest of the June lows, and potentially much more, comes into play.
To invalidate all of the above bearish analysis, I would want to see the S&P500 break above last week’s highs. We also want to see the emergence of new leadership within US Stocks. The stock market loves leadership, and we simply don’t have that right now. In fact, new weak links keep showing up. Most recently the Home Builders, REITS, Utilities, and now Staples have been getting hit pretty hard. Remember, these guys used to be the leaders. When your leaders start to fail, it can’t be a good thing.
Time will tell….
Trade em well!
Tags: $SPY $SPX $ES_F
We took a look at some pretty important charts on Friday after the close. S&Ps broke the big levels that we warned about last week. So Friday we discussed seasonality and breadth for the S&P500, Coffee futures potentially bottoming out here, Crude Oil to Natural Gas ratios, Big Blue – IBM and finally the positive correlations between housing and regional bank stocks.
Enjoy!
Tags: $IBM $KRE $HGX $XHB $SPY $CL_F $NG_F $UNG $USO $KC_F $JO