One of the most telling and obvious risk-on indicators would be the Nifty Small Cap 100 index. Why is that so?
Because when you look at a market rally, the longevity of that particular rally can be gauged by market participation. This is something that should be viewed closely. If a particular index is making new highs, how many stocks are contributing to that move?
Is it a handful? Is it a majority of the stocks? These are data points that will hint at the inherent sentiment of the move.
So let’s take a look at what the Small Cap-100 new highs are telling us.
Breadth indicators are important to see the internal structure of a market move. We get valuable insights from what we see that can help us determine the strength of the trend.
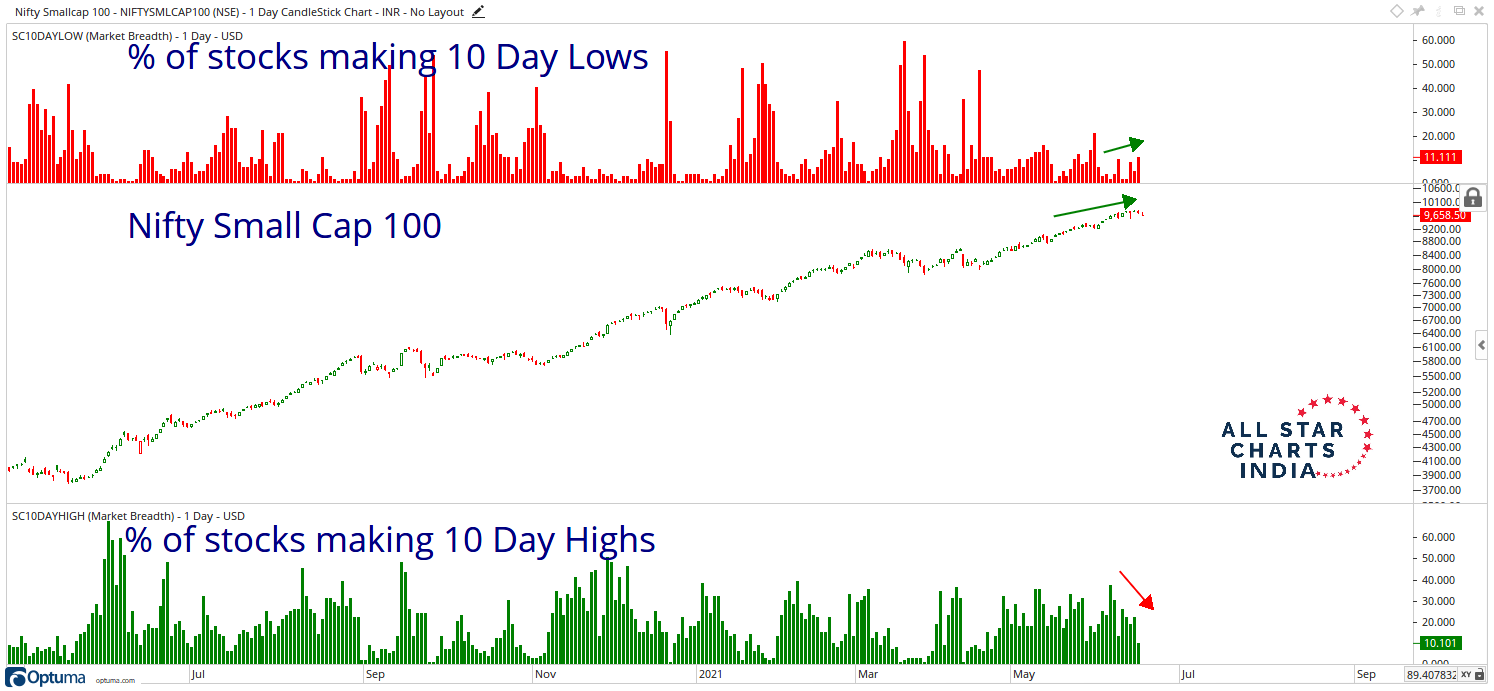
First up let’s take a look at the most immediate tactical view. Let’s take a look at the % of stocks making new highs//lows over a 10-day period. What we find is that as the Small cap 100 index clocked new highs, the % of stocks making 10-day highs contracted. On the other hand, we got a minor expansion in the % of stocks making 10-day lows.
That is certainly not the trend you’d like to see. You’d want to see an expansion in highs and a contraction in lows.
But from a tactical perspective, the opposite seems to be playing out. This tells us that we need to be wary of the move until we get further confirmation of an expansion in highs.
Click on chart to enlarge view.
To access our team’s Technical Analysis, you must be a premium member of All Star Charts India. Please login below or start your risk-free 30 day trial today.
Lost Password?