We retired our “Five Bull Market Barometers” in mid-July to make room for a new weekly post that’s focused on the three most important charts for the week ahead.
This is that post, so let’s jump into this week’s edition.
Expert technical analysis of financial markets by JC Parets
We retired our “Five Bull Market Barometers” in mid-July to make room for a new weekly post that’s focused on the three most important charts for the week ahead.
This is that post, so let’s jump into this week’s edition.
The Top/Down approach to markets is at the core of what we do at All Star Charts. That means starting at the asset class level and peeling back each layer to refine our view of the smaller components that make up that asset class. With each new layer, we discover information that helps us form our weight of the evidence conclusion.
That brings us to our weekly column, The Top/Down Take, where we hope to educate readers on how we execute this process and highlight its value through the analysis of popular stocks.
Last time it was Tata Consultancy (TCS), but today the stock we’re looking at is Dixon Technologies which made new all-time highs this week.
As we come into the week of Dhanteras and Diwali, and the celebrations that go with that, let us talk about some of the financial decisions we may consider at this time. I heard Swarup Mohanty at Mirae Asset Management say this a few weeks ago: “Dhanteras is the time for our Annual SIP into Gold.” It’s true and I’d never thought of it that way.
Buying Gold has been a traditional investment for many. But financial markets have developed to the point that we look at buying Gold as a financial decision – complete with its risks, rewards, and top-down analysis.
(I’m not sure if Mr. Mohanty came up with that expression or if I should have credited someone else. I heard it from him. Please forgive any mistakes in this.)
The market is telling us that Pharma stocks need more time to correct before they’re ready for their next leg higher.
Below are a few charts explaining why and how we’re approaching the sector going forward.
In today’s chart, we’re looking at the strongest sector of the market testing a key level.
Let’s get into it.
This week we’re looking at a long setup in the Fertiliser & Pesticide Industry.
We retired our “Five Bull Market Barometers” in mid-July to make room for a new weekly post that’s focused on the three most important charts for the week ahead.
This is that post, so let’s jump into this week’s edition.
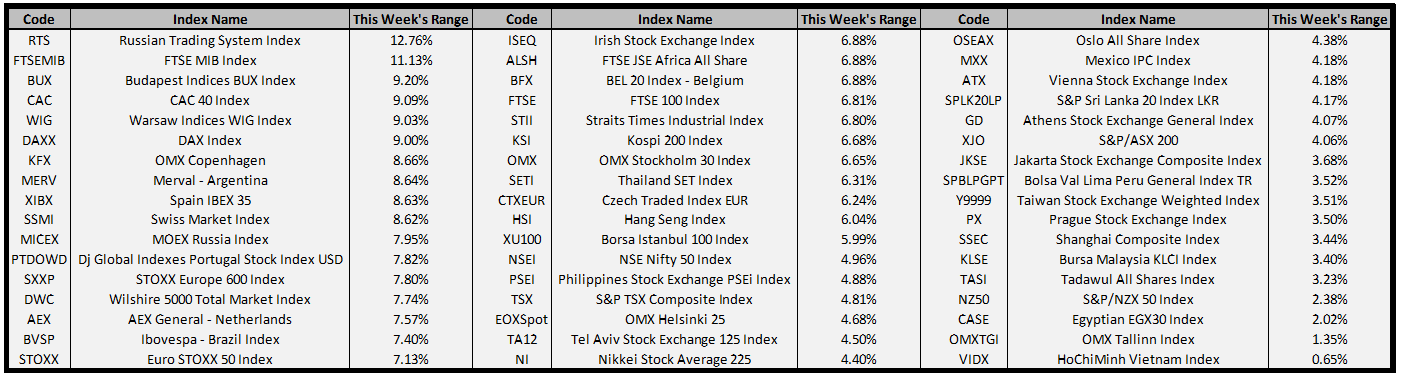
We’re winding down a long week across the globe and what’s clear is that there’s been a lot of movement.
The median weekly price range in the International Indexes we track on a local currency basis is 6.24%, with the highest being nearly 13%.
Click on table to enlarge view.
And we’re seeing similar volatility across asset classes.
But not all moves are created equal.