One of our favorite ways of looking at a sector or industry group is by using equally-weighted charts.
A lot of “Home TV” stocks have been on the move, so we’re going to take a look at what’s happening and determine what’s next for the group.
First, let’s take a look at our equally-weighted custom index of Den Networks, Hathway Cable, Sun TV Network, TV18Broadcast, and Zee Entertainment. Prices did break down to new all-time lows during the March decline, but quickly reversed and took out the downtrend line from their 2018 highs. Now, prices are testing former support/resistance with momentum diverging negatively, suggesting a near-term pause is likely.
Click on chart to enlarge view.

Longer-term it appears this bearish to bullish trend reversal is intact. Now we want to be watching closely to identify how much of the recent gains the index gives back. If prices can stabilize above their now upward-sloping 200-day moving average, that would be a positive and suggest further gains to come. With that said, a break above 107 is needed to confirm further broad-based strength from this industry group.
For now, since the trend is sideways, we need to remain very selective in how we play this theme.
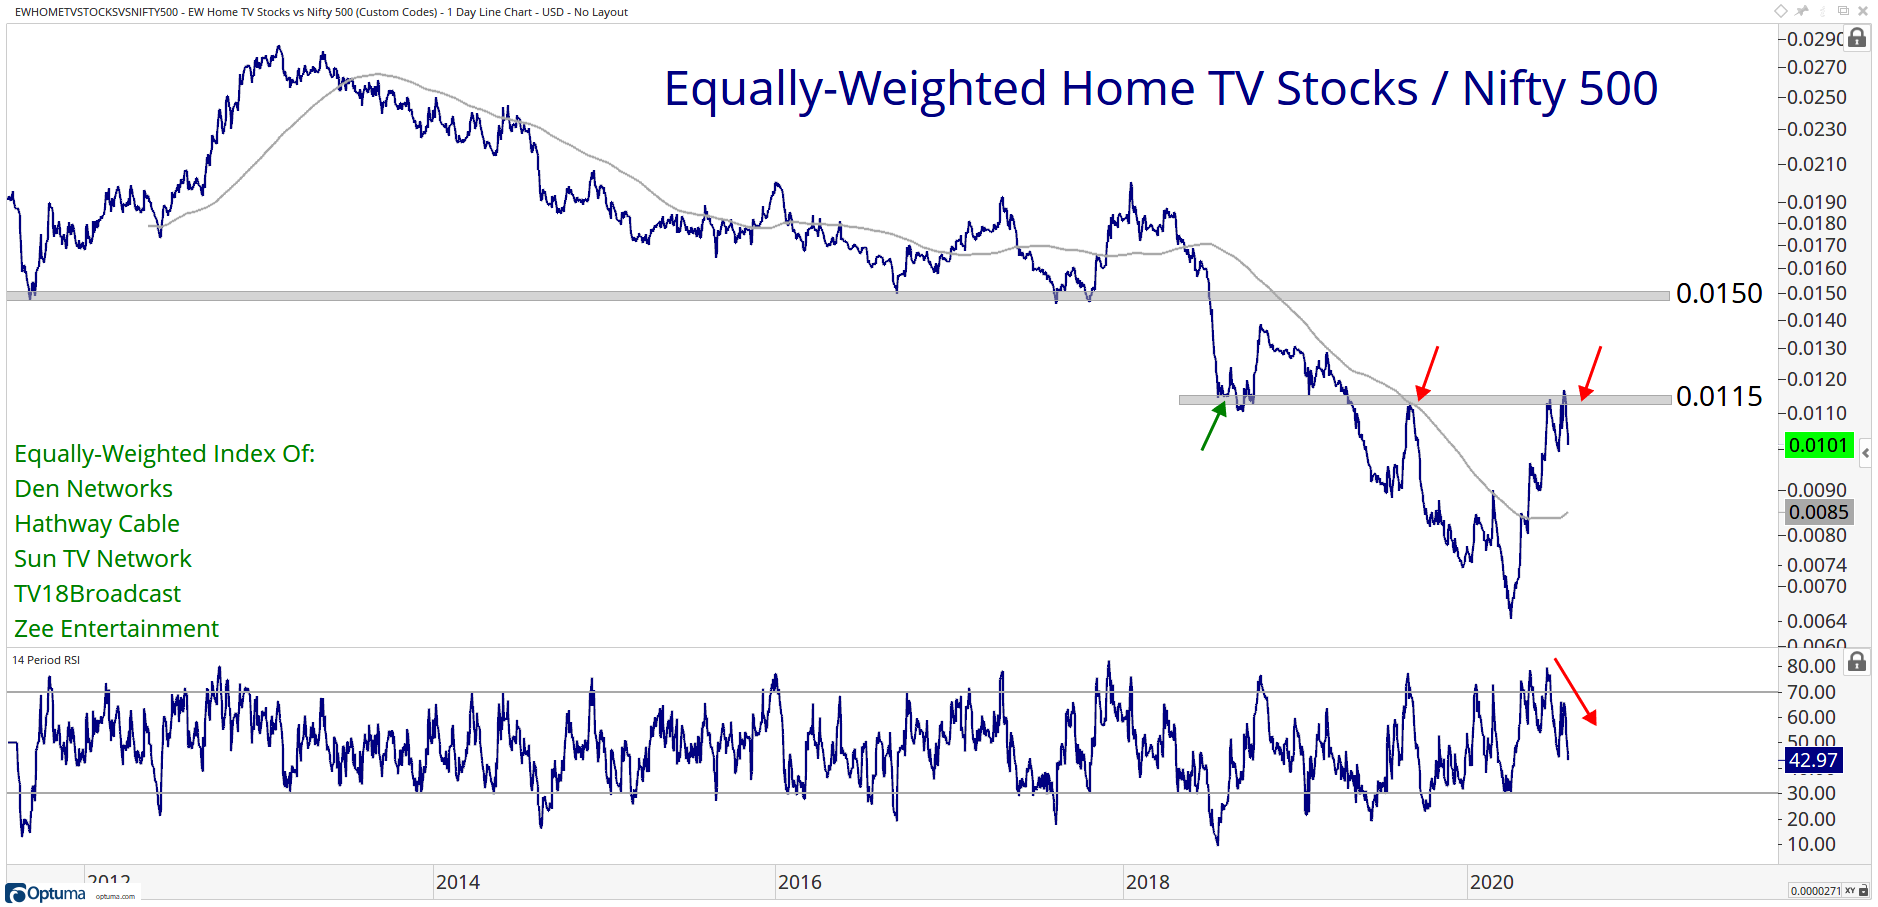
And here are prices of this index relative to the broader market, in this case, the Nifty 500. It’s at a very similar support/resistance level and is now pulling back. Prices would need to break above 0.0115 to confirm this bearish to bullish trend reversal and signal further upside towards 0.015.
After a strong move off the lows, the industry group’s price trend, relative strength, and absolute momentum are all improving, so we’d rather be erring on the long side than short of it.
With that said, we’re remaining selective until the equally-weighted index can make new absolute and relative highs and signal that all (or most) of its components are participating to the upside. Many of them are messy and it’s difficult for us to define our risk and identify attractive reward/risk entries for our timeframe.
To access our analysis of the stocks in this custom index, you must be a premium member of All Star Charts India. Please login below or start your risk-free 30 day trial today.
Lost Password?