From the Desk of Kimmy Sokoloff
Tech pushed higher yesterday.
Let’s see if we have follow-through today.
Expert technical analysis of financial markets by JC Parets
From the Desk of Kimmy Sokoloff
Tech pushed higher yesterday.
Let’s see if we have follow-through today.
The market’s been in consolidation mode, and that continued today — except for the typical $AAPL/$AMZN/$GOOGL/$MSFT rally.
$SPY and $QQQ reclaimed their eight-day moving averages.
From the Desk of Kimmy Sokoloff
As I write, $SPY and $QQQ are below their respective eight-day moving averages.
They could potentially be heading down to their 21-day moving averages, which is roughly 429 on SPY and 354 on QQQ.
From the desk of Steve Strazza @Sstrazza
Welcome to the 2 to 100 Club.
Something we’ve been working on internally is using various bottoms-up tools and scans to complement our top-down approach. It’s really been working for us!
One way we’re doing this is by identifying the strongest growth stocks as they climb the market-cap ladder from small- to mid- to large- and, ultimately, to mega-cap status (over $200B). 
Once they graduate from small-cap to mid-cap status (over $2B), they come on our radar. Likewise, when they surpass the roughly $30B mark, they roll off our list.
But the scan doesn’t just end there.
We only want to look at the strongest growth industries in the market, as that is typically where these potential 50-baggers come from.
Some of the best performers in recent decades – stocks like Priceline, Amazon, Netflix, Salesforce, and myriad others – would have been on this list at some point during their journey to becoming the market behemoths they are today.
When you look at the stocks in our table, you’ll notice we’re only focused on Technology and Growth industry groups such as Software, Semiconductors, Online Retail, Solar, etc.
Then, like any good technician, we filter the list down to those closest to new highs.
This allows the cream of these strong groups to rise to the top and helps streamline our mission to identify technical breakouts in the top-performing stocks.
From the Desk of Ian Culley @IanCulley
Dollar bulls, be warned!
The US Dollar Index $DXY is sliding toward the lower bounds of a multi-month range.
Yes, it’s still a sideways mess. And it will remain a mess as long as its former support level holds.
But based on the most recent data, my money is on a downside resolution for King Dollar.
Especially when I consider last week’s breakout in Canadian dollar futures…
The Nasdaq pulled in the most today, with $QQQ dropping down to its eight-day moving average.
Now, this is either a bull flag or we’ll head lower.
[September 7: stop on this trade has been updated to 96 as we approach expiration]
“Gimme something messy.”
This was the directive today when looking for a chart in a stock or sector ETF that was exhibiting consolidating trading action and low implied volatility (“cheap”) options.
A few names were batted around and we landed at this chart of the 20-year T-Bond ETF $TLT:
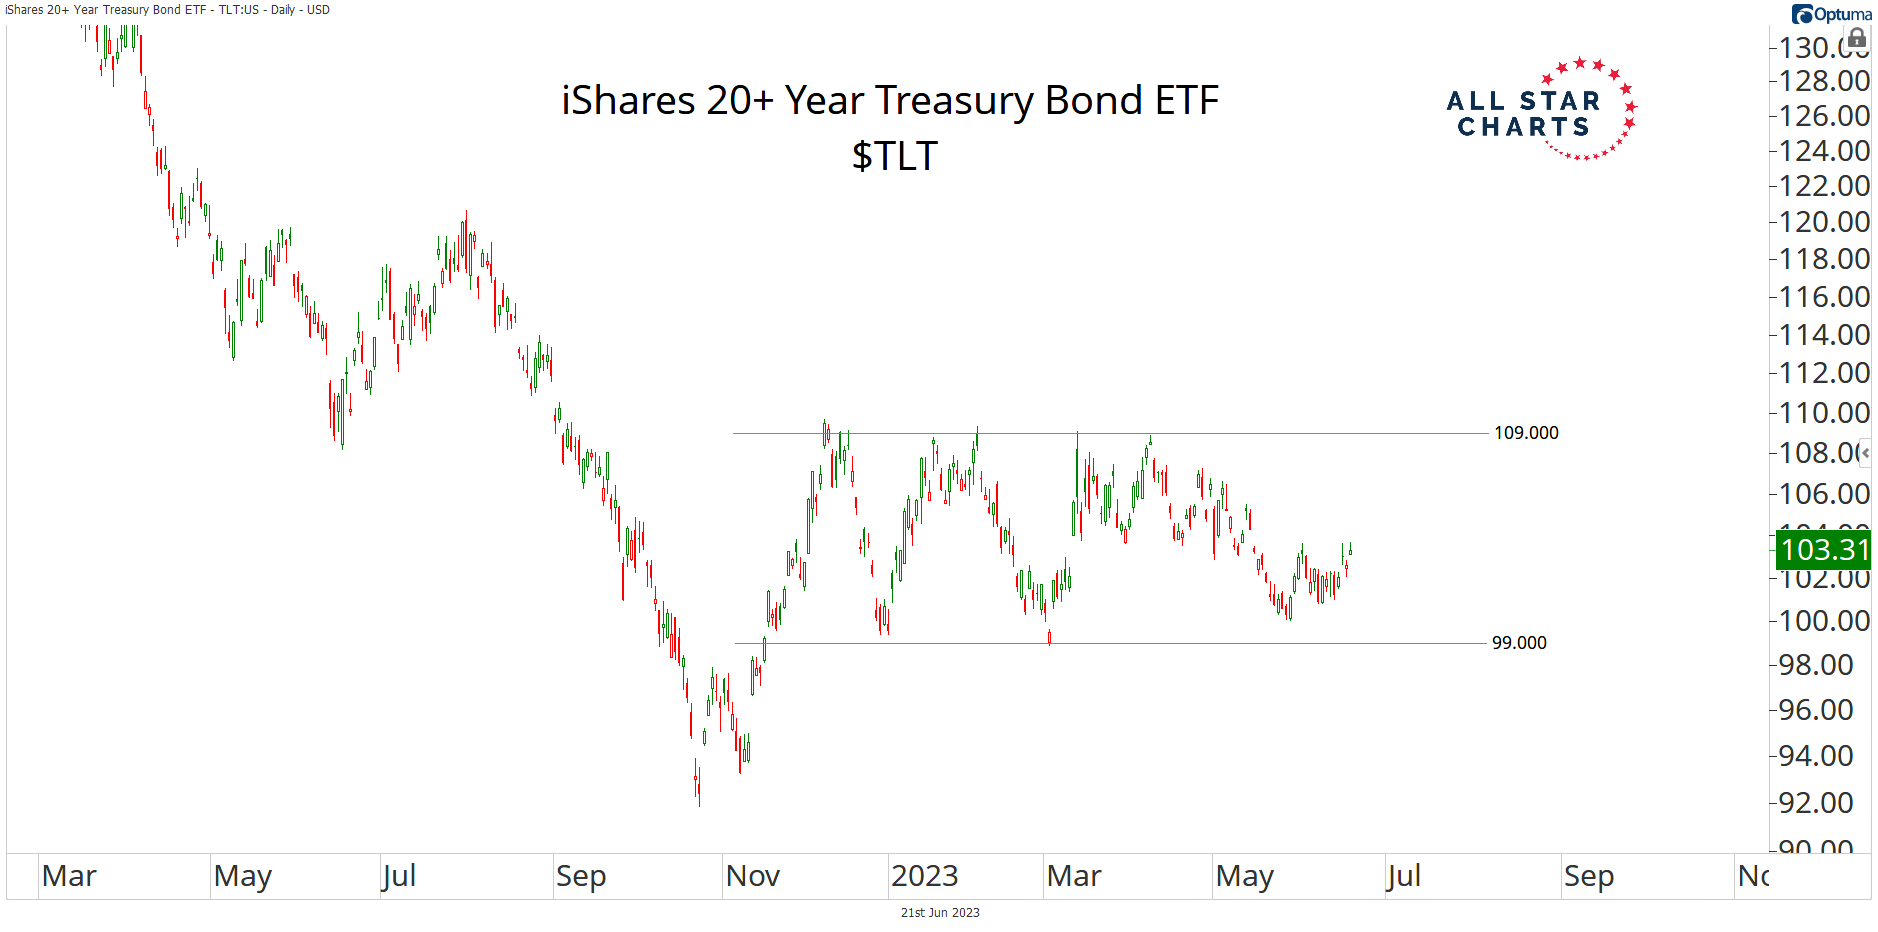
After putting in a low in October of last year, $TLT has spent 2023 frustrating bulls and bears alike in a trading range bounded by 99 and 109.
Meanwhile, notice how options premiums, as expressed by this implied volatility chart for $TLT, have been trending lower since $TLT bottomed last October and are near the lowest levels?
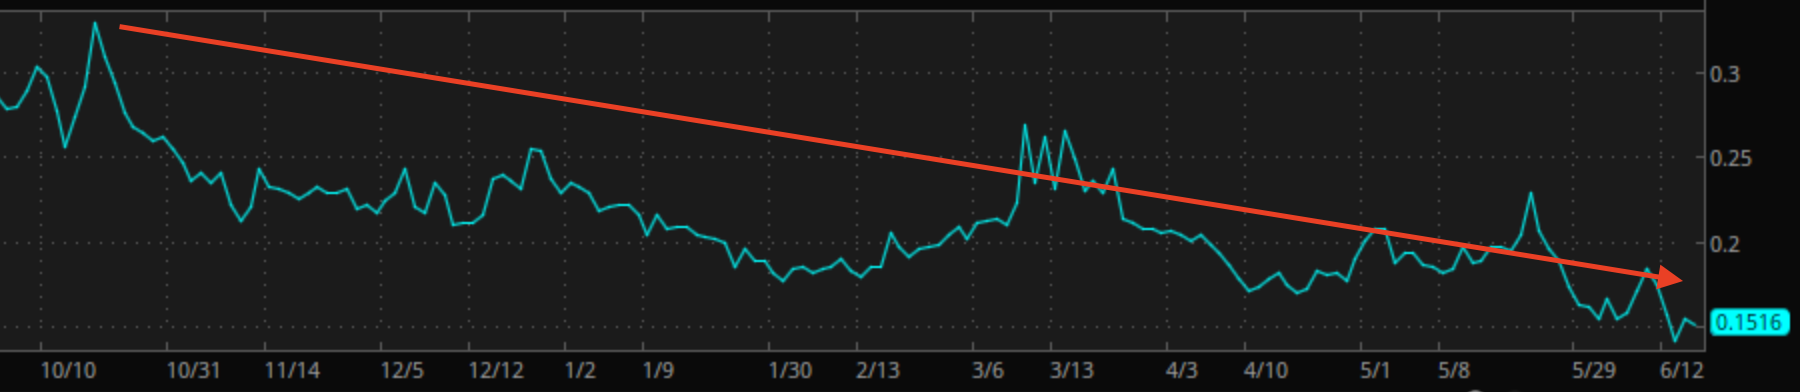
This trend can surely continue lower, but this isn’t the bet we’re making. We’re betting that $TLT is set for a range expansion soon and we want to leverage cheap options premiums to position for a big move in either direction for $TLT.
Here’s the Play:
I like buying a $TLT September 103 Straddle for approximately $6.25. This means we’ll be long both the 103 calls and an equal amount of 103 puts. And this debit we pay is the absolute most we can lose if we held this position all the way until expiration (we won’t) and $TLT closed precisely at $103 on September 15th (unlikely).
While it is unlikely we’ll suffer a 100% loss on our invested capital, I will look to manage risk if the position losses 50% of its value. At that point, I’ll cut the dead wood and move on with my life.
What we’re hoping for is a range expansion that takes $TLT either north of $109 or south of $99. If that happens, then we’ll likely be holding a profitable position. That said, I’m not going to be greedy with this trade…
If our position doubles in value to $12.50, I’ll exit the trade and take my profit. However, there is a caveat: if the breakout happens soon (like, in the next 30 days), then I’ll just sell half at $12.50 and let the rest ride because that would be a huge signal that we may have nailed the timing for a big breakout.
If you have any questions on this trade, please send them here.
ASO subscribers who missed last week’s video Jam Session where we reviewed activity in our options portfolio from the past week can catch it here.
P.S. We do trades like this regularly. If you’d like to leverage Best-in-Class technical analysis into smarter directional options trades, try out All Star Options Risk Free! Or give us a call to learn more: 323-421-7991.
From the Desk of Kimmy Sokoloff
This morning the market is unchanged.
And we have Fed Chair Jerome Powell speaking at 10:00 a.m. ET.