This is the weekly post that aggregates all the charts we put together throughout the week and organizes them all into one, easy to flip through deck.

Expert technical analysis of financial markets by JC Parets
This is the weekly post that aggregates all the charts we put together throughout the week and organizes them all into one, easy to flip through deck.
From the desk of Steve Strazza @Sstrazza
We held our November Monthly Strategy Session Wednesday night. Premium Members can access and rewatch it here.
Non-members can get a quick recap of the call simply by reading this post each month.
By focusing on long-term, monthly charts, the idea is to take a step back and put things into the context of their structural trends. This is easily one of our most valuable exercises as it forces us to put aside the day-to-day noise and simply examine markets from a “big-picture” point of view.
With that as our backdrop, let’s dive right in and discuss three of the most important charts and/or themes from this month’s call.
From the desk of Steve Strazza @Sstrazza
Our Hall of Famers list is composed of the 150 largest US-based stocks.
These stocks range from the mega-cap growth behemoths like Apple and Microsoft – with market caps in excess of $2T – to some of the new-age large-cap disruptors such as Moderna, Square, and Snap.
It has all the big names and more.
It doesn’t include ADRs or any stock not domiciled in the US. But don’t worry; we developed a separate universe for that. Click here to check it out.
The Hall of Famers is simple.
We take our list of 150 names and then apply our technical filters so the strongest stocks with the most momentum rise to the top.
Let’s dive right in and check out what these big boys are up to.
From the Desk of Steve Strazza @Sstrazza
When investing in the stock market, we always want to approach it as “a market of stocks.”
Regardless of the environment, there are always stocks showing leadership and trending higher.
We may have to look harder to identify them depending on current market conditions. But there are always stocks that are going up.
The same can be said for weak stocks. Regardless of the environment, there are always stocks that are going down, too.
We already have multiple scans focusing on stocks making all-time highs, such as Hall of Famers, Minor Leaguers, and the 2 to 100 Club.
We filter these universes for stocks that are exhibiting the best momentum and relative strength characteristics.
Clearly, we spend a lot of time identifying and writing about leading stocks every week, via multiple reports.
Now, we’re also highlighting lagging stocks on a recurring basis.
From the desk of Steve Strazza @Sstrazza.
Welcome back to Under the Hood, where we’ll cover all the action for the week ended October 27, 2023. This report is published bi-weekly and rotated with The Minor Leaguers.
What we do here is analyze the most popular stocks during the week and find opportunities to either join in and ride these momentum names higher, or fade the crowd and bet against them.
We use a variety of sources to generate the list of most popular names.
There are so many new data sources available that all we need to do is organize and curate them in a way that shows us exactly what we want: a list of stocks seeing an unusual increase in investor interest.
Click here for a behind-the-scenes look at our process.
Whether we’re measuring increasing interest based on large institutional purchases, unusual options activity, or simply our proprietary lists of trending tickers, there’s a lot of overlap.
From the Desk of Alfonso Depablos @Alfcharts
The outlook for equities continues to deteriorate as sellers gain momentum.
We’ve already discussed how the weakest areas of the market are leading to the downside. Meanwhile, the strongest sectors and industry groups remain stuck below overhead supply, with a growing list of charts completing tactical tops.
The Russell 2000 falls into the first category, as “the smaller, the weaker” remains the theme for stocks.
As such, it isn’t a surprise to see the Russell 2000 Index $IWM violate a critical polarity level and follow other laggards lower:
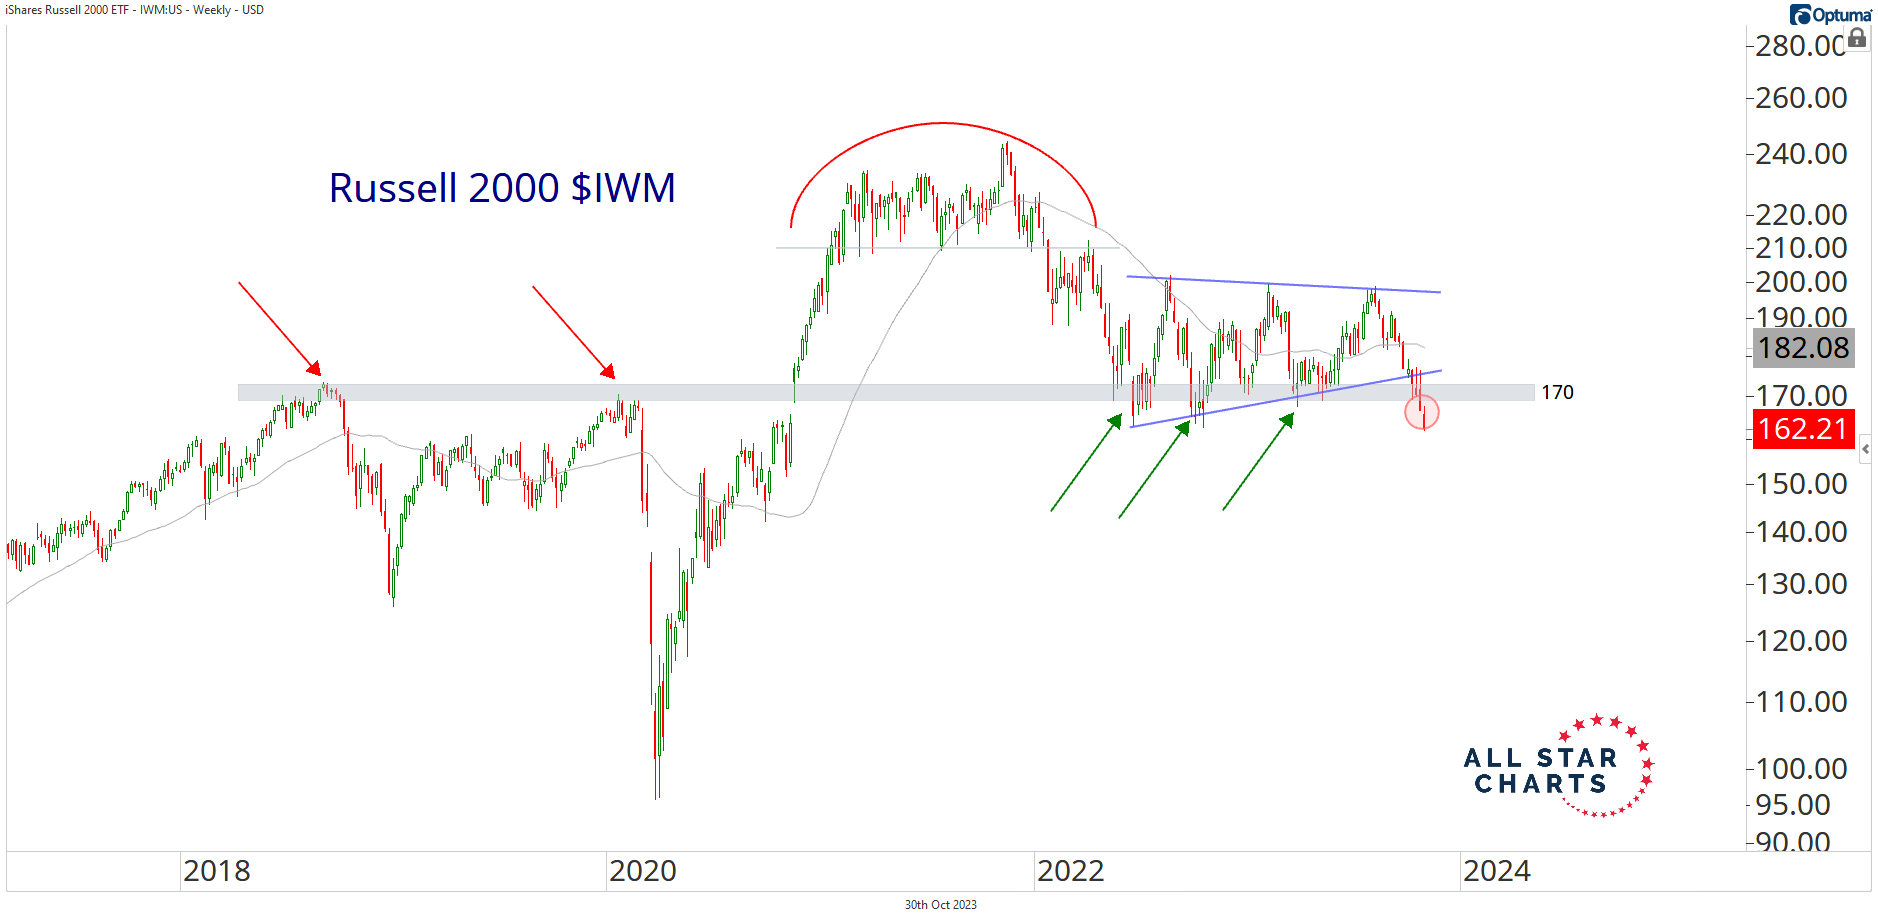
This area represents the prior cycle highs from 2018 and 2020. We think 170 in IWM is as important as any level on any chart right now.
We will watch closely in the coming days and weeks to see how price reacts to this former resistance zone… as well as the pivot lows, which come into play in the low 160s.
This is a logical level for a short-term bounce, but the question is whether buyers can repair the damage and reclaim this level in a sustainable way.
On the flip side, if we get downside follow-through in the near-term, we must anticipate another leg lower for this beaten-down group of stocks.
And if the Russell comes under further pressure, the S&P and Nasdaq will likely follow a similar path lower.
The bottom line is that more and more risk assets falling back below their prior cycle highs is a big feather in the hat for bears.
As always, we love to hear from you, so shoot us a note and let us know what you think.
Alfonso
From the Desk of Steve Strazza @sstrazza and Alfonso Depablos @Alfcharts
This is one of our favorite bottom-up scans: Follow the Flow.
In this note, we simply create a universe of stocks that experienced the most unusual options activity — either bullish or bearish, but not both.
We utilize options experts, both internally and through our partnership with The TradeXchange. Then, we dig through the level 2 details and do all the work upfront for our clients.
Our goal is to isolate only those options market splashes that represent levered and high-conviction, directional bets.
 We also weed out hedging activity and ensure there are no offsetting trades that either neutralize or cap the risk on these unusual options trades.
What remains is a list of stocks that large financial institutions are putting big money behind.
And they’re doing so for one reason only: because they think the stock is about to move in their direction and make them a pretty penny.
Then we flip through our list of stocks flashing unusual activity and pick the best setups using many of the same technical filters we do for our other scans.
And, just like that, we’ll follow the money flow and fatten our own pockets along with some of the world’s most powerful financial institutions.
This is the weekly post that aggregates all the charts we put together throughout the week and organizes them all into one, easy to flip through deck.