Here is the clip from Thursday’s CNBC Fast Money.
I get going at the 5 minute mark:
Source:
Tags: $SPY $SPX $ES_F
Expert technical analysis of financial markets by JC Parets
Here is the clip from Thursday’s CNBC Fast Money.
I get going at the 5 minute mark:
Source:
Tags: $SPY $SPX $ES_F
I think it’s important every now and then to take a step back and really compare today’s market environment to similar circumstances throughout history. It helps to gain some perspective on where we are and where we’ve been. And maybe, some of that information can shed some light on where we’re going.
Today’s Chart of the Day plots every Dow rally in terms of both magnitude and duration. Rallies in the Dow Jones Industrial Average, according to this chart, represent any advance that came after a 30% decline. There have been 13 such instances since 1900, which on average is one every 8.5 years or so.
Here is the chart showing how our current stock market rally (off the March 2009 lows) is below average in both magnitude and duration:
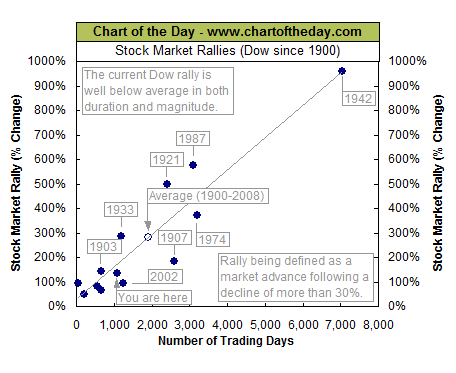
The good folks at Chart of the Day also note that when you compare the current advance to the most recent post-major bear market rally (i.e. the rally that began in 2002), this bull market is significantly greater in magnitude but also accomplished this feat in less time. I thought that was interesting. But if you go back further in history, this “huge rally” is really nothing special. At least not yet…
Source:
Stock Market Rallies: Dow Since 1900 (Chart of the Day)
Tags: $DJIA $DIA $YM_F $DJI
This is something that I’ve been watching very closely. And even more so recently as some bullish divergences have begun to appear. The way I see it, US Stocks have been ripping to all-time high territory all year while emerging markets have essentially been crashing. I’m not a believer in the concept of “decoupling”, so I’m in the camp that at some point, something’s got to give. Either US Stocks back off to come down to EM, or EM rallies and catches up to us.
Most of the Emerging world seemed to have peaked on the first trading day of 2013. Since then Brazil lost almost 30%, China 25%, Russia 23%, India, etc. And not just the BRICs either, a lot of the Asia Pacific region had their big sell-offs too, like Philippines for example losing 30% from the May 22nd highs. Meanwhile, most of the major US averages are closing at all-time high territory.
So here is the chart of the MSCI Emerging Markets Fund vs the S&P500 Index Fund. What catches my attention is the bullish divergence setting up in momentum. As prices made fresh lows recently, the relative strength index has already turned up. Add that to the 200 day moving average sitting 20% away from recent lows, and you have a set up that can’t be ignored:
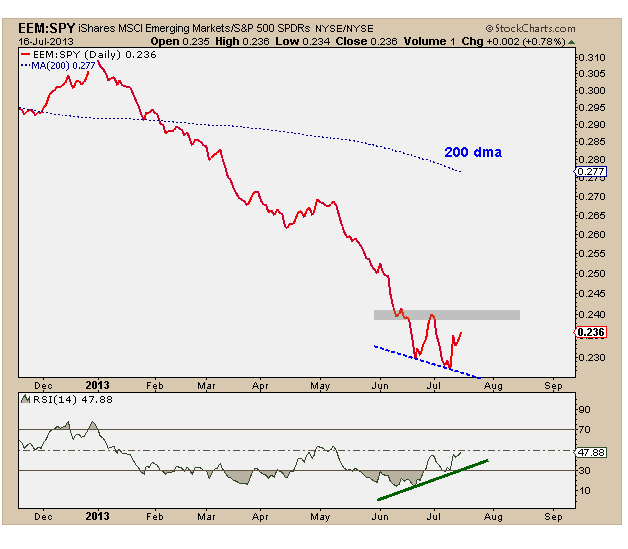
We want to start to see that 24 and change level (shaded gray) get taken out for confirmation of higher highs, but the set up right now is certainly developing. I think we could possibly be at the start of a nice actionable mean reversion. Stay tuned…
Tags: $FXI $EEM $EPI $RSX $SPY $EWZ
A few of the major US stock market averages have already exceeded their May highs, in particular the Russell2000, Nasdaq100 and the Russell MicroCap Index. But some of the important ones still have not. Today I want to take a look at the S&P500, which has rallied 3 straight weeks to get back up to former resistance. Should we care? Is this something we should act on?
Here’s the chart of the S&P500 Index:
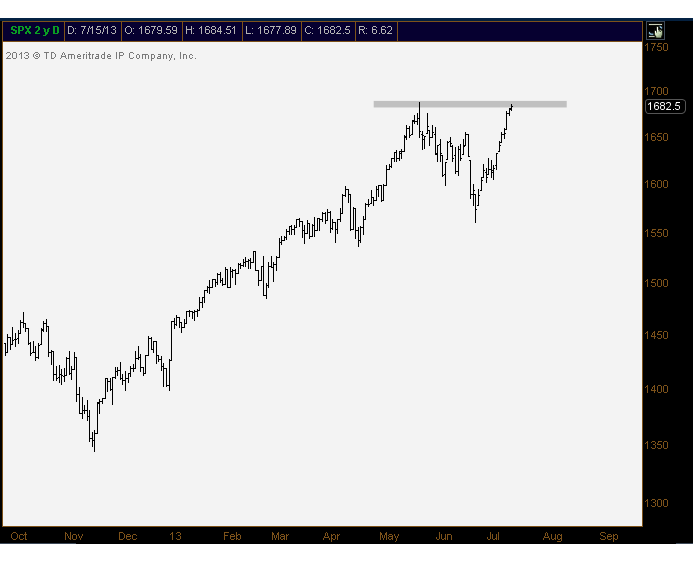
Approaching this week with a level head and an open mind, I ask myself, Is this somewhere I want to be buying? Well, can we just blow right past this resistance and keep going on to all-time highs without looking back? Sure, the market can do anything I suppose. But is that the high probability move? It’s not to me.
The Dow Jones Industrial Average is in the same boat. Here we are, right back to May resistance:
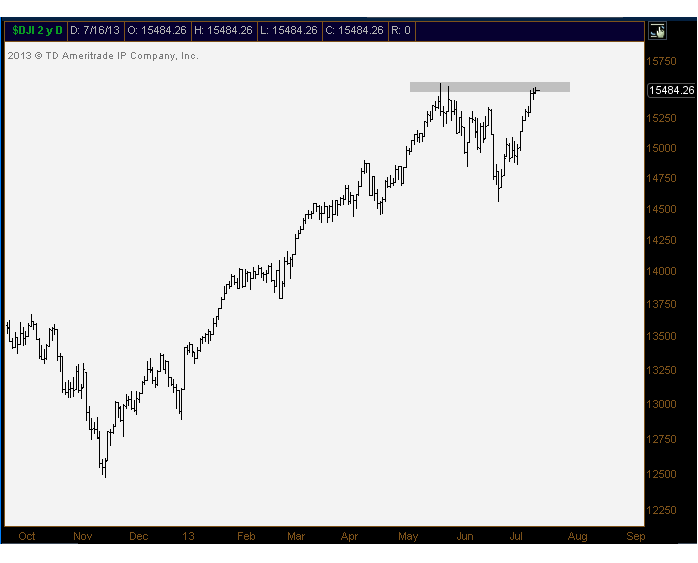
So will the Dow and S&P just keep ripping without at least temporarily acknowledging these levels? I can’t put my money behind that thesis with a straight face. At least not as of this morning.
Tags: $SPX $SPY $ES_F $DIA $DJIA $IWC $IWM $QQQ
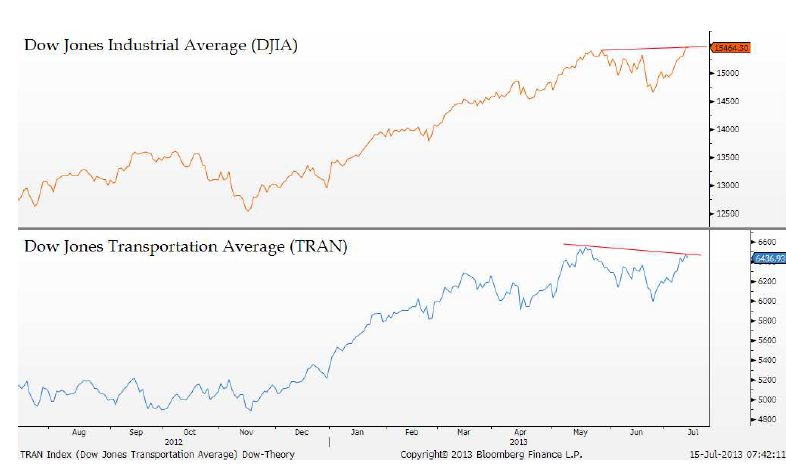
In bull markets, you want to see both the Dow Jones Industrial Average and the Dow Jones Transportation Average making new highs together. Dow Theory suggests that when one of these gets left behind and doesn’t confirm the other, something is wrong and there should be cause for concern.
Last week the Dow Industrials closed at new all-time highs, and now sit above their May closing highs. Meanwhile, the Transports are still almost 2% from their May highs. So if you believe in Dow Theory, you want to see these transporation stocks get going quickly.
My friend Jonathan Krinsky, CMT over at Miller Tabak has a note out this morning discussing the current divergence:
“The Transports, however, should certainly be given some attention this week. The TRAN index made its all-time closing high on May 17th. Prior to last week, the DJIA all-time closing high was May 28th. So there was already a slight “non-confirmation”, but from our perspective, the time between the two highs was not sufficient to classify as a true “Dow Theory non-confirmation”.
The current divergence, on the other hand, would be nearly two months in the making (chart below). Of course, this could easily resolve itself with a rebound in key transport stocks such as United Parcel Service (UPS) and FedEx (FDX). The index is less than 2% away from those May closing highs. Until then, however, this is a small divergence that Bulls would certainly like to resolve sooner, rather than later.
Bottom Line: It is hard to ignore the strength that was seen last week. Much like “The Running in Pamplona”, Bulls pretty much did everything they wanted, with an unrelenting climb. With most momentum indicators running in overbought territory, the NDX coming off 13 consecutive up days, and a potential “Dow Theory Non-Confirmation”, however, we are still hesitant to chase stocks without at least a few days of consolidation.
That does not mean that stocks are huge short-sales, however. There is very little evidence of a broad based decline, at least yet. Our point is that sometimes holding-off on aggressively buying, and waiting for better opportunities is the correct strategy.”
I think something else worth noting is the NYSE Composite. Because of all the ADRs and REITs in that average, it’s by far the worst of the US Stock Market gauges. We’re paying attention to that.
Source:
Morning Technical Perspective July 15, 2013 (MillerTabak)
Tags: $DJT $DJI $DJIA $IYT
Can you believe we’re already halfway through July? Amazing how fast time goes.
I like today’s video because I got to explain the thought process as I got a trade wrong. And not that it was irresponsibly wrong, it just didn’t work. I’d put it on again 100 times out of 100. But we managed risk the best we could and moved on.
Freeport McMoran is another chart that I keep bringing up, but it’s just so fascinating to me. We’re at such important levels that I’m so excited to see how this story unfolds. We have some options exposure, but looking to short it outright on an official break. This thing needs to start moving higher right now, or else….
Enjoy:
Tags: $FCX $SPY $SPX $NFLX $GOOG
Investor sentiment is definitely something we think is important to monitor. But because of the week-to-week noise that is associated with some of these polls, it’s not anything we’re going to make portfolio-altering decisions from it too often. But when bulls or bears hit certain extremes that are seen less frequently, it stands out to us.
Today I wanted to point to the fact that right now nearly 3 out of every 4 investors are expecting stocks to rally over the next 6 months. This according to the latest survey of individual investors from AAII. The chart below comes from Sentiment Trader and shows the last several times that the Bull ratio was above 70%:
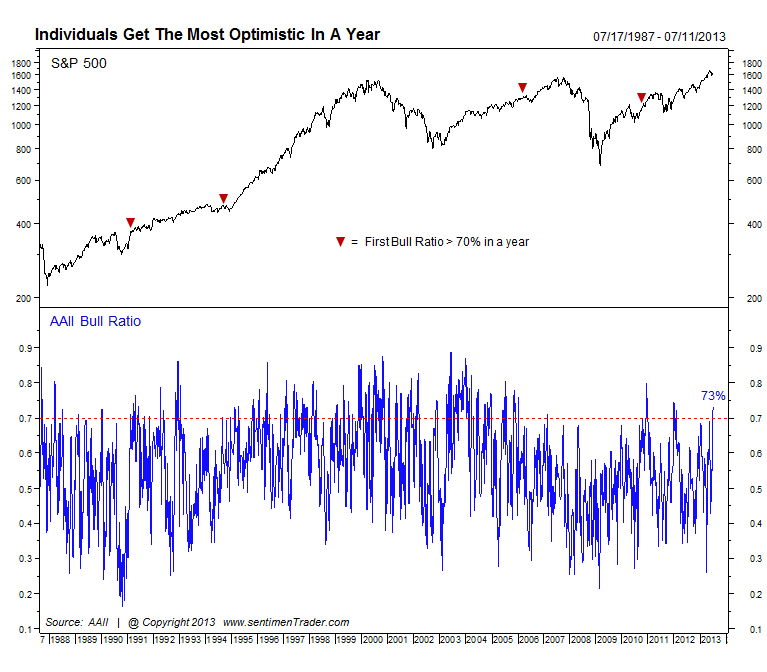
We’ve seen bulls hit extremes like this in the past. A lot of times the market consolidates either through price or time in the short-term. But historically these particular levels of optimism haven’t necessarily been a negative signal over the long-term. I thought that was interesting.
Source:
Busy day over at Eagle Bay Capital on Thursday. Not a lot of tweets or blog posts. But I figured I’d take a few minutes to share some thoughts on this market.
I came into the week not really trusting last week’s rally. The roll over in regional banks on Monday caught my attention. That red candle really stood out to me, so we took advantage of the short side. Wednesday morning shorts were working great. The US Stock Market seemed vulnerable to me and destined to fail. This was pre-fed minutes. At the time it seemed like a good idea to press the shorts and try to hit it out of the park. For a short period I had the biggest short position that I’ve had on in a while. But it didn’t work. The market stayed strong going into the end of the day. So we pulled out and admitted we were wrong (see here).
The only shorts that kept working today were in regional banks. It’s the only place where I’ve been consistently right this week. I figured the rest of the market would follow, but unlce ben’s comments were apparently too much. The market strength is out of control right now. It’s hard to fight it. So we won’t. At least for now…
Make sure to check out the video that Dr. Phil Pearlman and I will be putting together on Friday after the close. I think it’ll be a good one.
Tags: $KRE $SPY