Markets across the globe have been taking a breather as the momentum cools off. Taking a closer look back home, the indices have been largely choppy and have consolidated over the past two months.
Is this merely a consolidation? Or are we looking at a minor correction ahead? Let’s take a look at what the charts have to say.
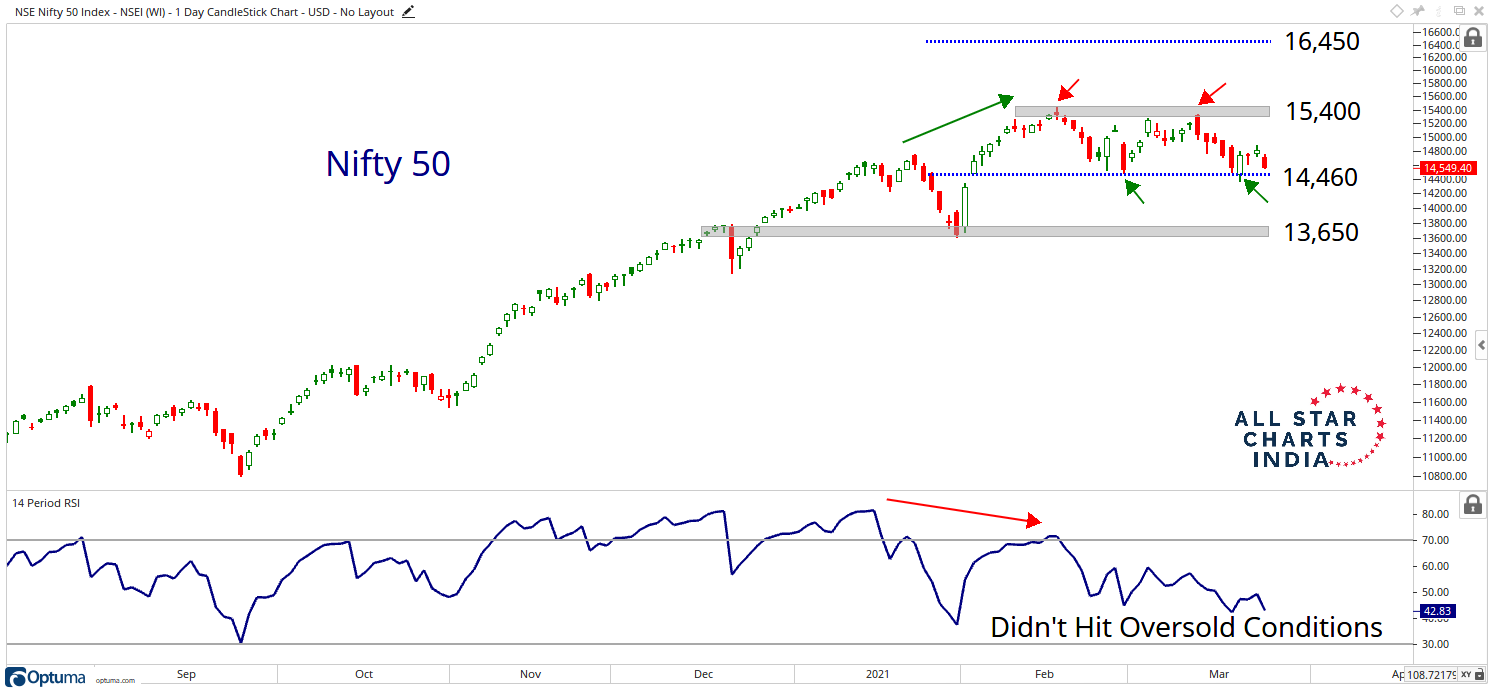
In our Three Charts for the Week post, we talked about the resistance Nifty had been facing at 15,400 and also highlighted the crucial support at 14,460. We noticed a divergence in Nifty in January and that has continued to play out as the rally progressed. Within the current setup, the price hasn’t been able to move past the 15,400 mark, in addition to now challenging the support level of 14,460.
A breach of 14,460 will lead to a lower high lower low formation on the daily chart, indicating an interim correction in the ongoing bull rally. The next level to track would then be 13,650, which is the next swing low. Up until now, the market has been largely messy and has only moved sideways. A breach of the support at 14,460 however, could trigger a short-term correction meaning that we would have to be fastidious in our stock selection.
Click on chart to enlarge view.
Let’s also take a look at the Mid- & Small-Cap indices.
To access our team’s Technical Analysis, you must be a premium member of All Star Charts India. Please login below or start your risk-free 30 day trial today.
Lost Password?