This is the video recording of our July 22, 2022, All Star Charts Crypto Weekly Strategy Session.
The Intuitive Value of Using Crayons
From the desk of Louis Sykes @haumicharts
There’s a common adage around here, a bit of advice to “draw your lines with crayons, not pens and pencils.”
What it means is that when you’re drawing support and resistance levels, it’s best to construe them as zones rather than in terms of a single price.
It’s a good rubric and a sound principle. But it makes sense to explore in greater detail why this is the case, particularly for cryptocurrency.
When it comes to this new asset class, technicals are a far more popular choice among traders and investors. It only makes sense in a market where there aren’t nearly as many sophisticated fundamentals.
You’re not going to discount a crypto project’s cash flows to arrive at a valuation; you’re going to trade the chart.
But, amid the growing popularity of technical analysis, proponents often don’t recognize why price action principles work. There’s far more to understand beyond drawing rectangles on charts.
So, let’s explore what makes “supply and demand” work as a primary trading and analytical indicator, how to apply it, and why we argue for using crayons over pens and pencils when identifying these levels.
So, What’s the Trade?
Yesterday, we explained how we’re still approaching this recent rally with a high degree of caution.
Most names still find themselves below overhead supply, and this is a tape where whipsaws and fake-outs are likely to continue.
Beyond Ethereum and a handful of other names, this rally hasn’t been widespread. Instead, most cryptos are still exhibiting generally weak action.
While this means there are still actionable ideas out there from the long side, we want to explore a higher-conviction trade over more substantial time frames that’ll likely be prone to fewer whipsaws.
Treat the Pump Cautiously
From the desk of Louis Sykes @haumicharts
In recent months, we’ve argued in favor of a defensive approach.
Last week, we made our strategy rather clear with the following dialogue:
With the market providing extreme readings, these are conditions by which we can anticipate a mean-reversion rally higher. At the same time, trying to catch this move in a period of continual whipsaws will be difficult.
We think the better trade is to remain patient over the near term while dollar-cost averaging into long-term spot positions with a multi-year time frame.
Over the weekend, we’ve seen a sharp rally higher, driven by Ethereum $ETH.
[Crypto] Weekly Strategy Session – July 15, 2022
This is the video recording of our July 15, 2022, All Star Charts Crypto Weekly Strategy Session.
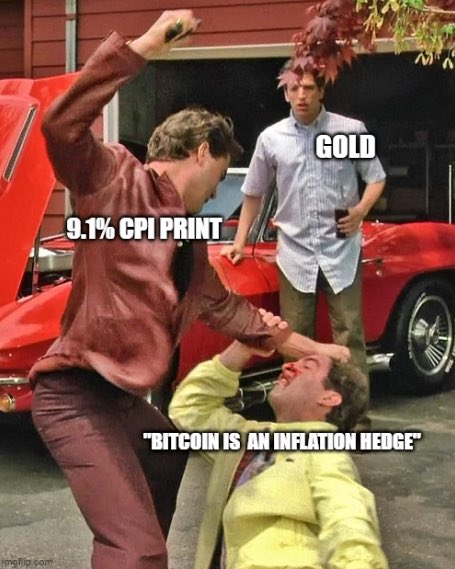
“Bitcoin Is an Inflation Hedge”
Yesterday was a 101-level class on why to follow money flow as opposed to narratives.
We were presented with a CPI of 9.1%, exceeding the expectations of 8.8%. By CPI standards, this is the highest inflation in 40 years.
And, yet, gold got crushed.
I saw this meme while mindlessly scrolling through Twitter and found it pretty hilarious:
Walk Away
Sometimes it’s just best to ignore breakouts.
It’s all about knowing what environment we’re in and adjusting our tools and strategies accordingly. In environments like these, buying into breakouts is a dangerous game.
Seriously, take a look at the failed breakouts all over the place.
Pull up a watchlist of cryptos and you’ll see a ton of whipsaws.
The Long Repair Begins
In our last letter, we reviewed the recent quarter and provided a structural view of the market.
In a tape as messy as this, we’re focusing a good portion of our strategy on longer time frames. The market has been and continues to be a mess on shorter time frames, while equity markets still firmly reflect risk-off behavior.
With the market providing extreme readings, these are conditions by which we can anticipate a mean-reversion rally higher. At the same time, trying to catch this move in a period of continual whipsaws will be difficult.
- « Previous Page
- 1
- …
- 14
- 15
- 16
- 17
- 18
- …
- 43
- Next Page »