Is this market fun or what?
Dr. Phil and I did a short video where we discussed S&P levels, Treasuries, Emerging Markets, Copper, Brazil and China. Check it out:
Tags: $FXI $TLT $ZB_F $DX_F $EEM $HG_F $IYR XLU $EWZ
Expert technical analysis of financial markets by JC Parets
Is this market fun or what?
Dr. Phil and I did a short video where we discussed S&P levels, Treasuries, Emerging Markets, Copper, Brazil and China. Check it out:
Tags: $FXI $TLT $ZB_F $DX_F $EEM $HG_F $IYR XLU $EWZ
How is the market going to react to these old 2007 highs? Does that famous 1576 even matter anymore?
What do you guys think? Should this serve as some support, now that we’re back to what many have called a historic breakout and confirmation of a new secular bull market for US stocks?
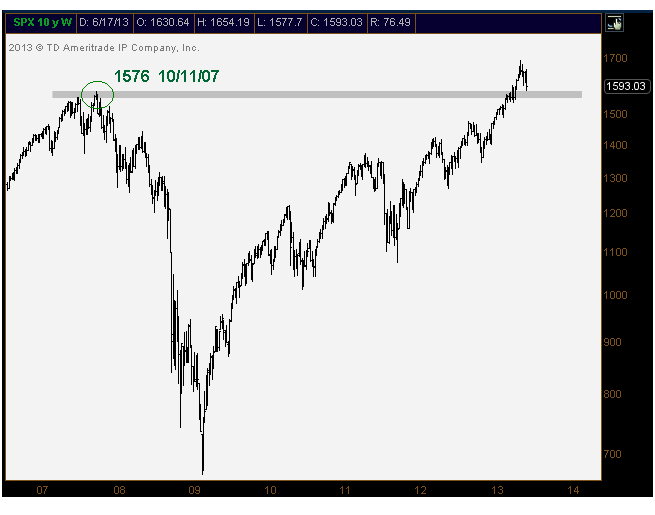
For you breakout & retest aficionados, I’d imagine you love this one. Me personally, I’m not sure what to think. I’ll tell you this though, it’s not something I’m making any decisions based off of. But I do think it’s interesting to bring up and at least discuss. What do you guys think? Is this relevant?
Tags: $SPX $SPY
Nowhere to hide this week as all of the above are getting sold relentlessly. The selling in stocks all over the world continues and has now finally hit the states. Uptrend lines are broken across the board. Bonds continue to get smoked as 10-yr yields are back to levels not seen since 2011. And metals keep getting destroyed as they lead the commodities sell-off.
So where is this money going? Not the yen like I had guessed they would. Nope – the good old US Dollar is the only bright spot around the globe. Check out this monster since Uncle Ben started his moonwalk on Wednesday:
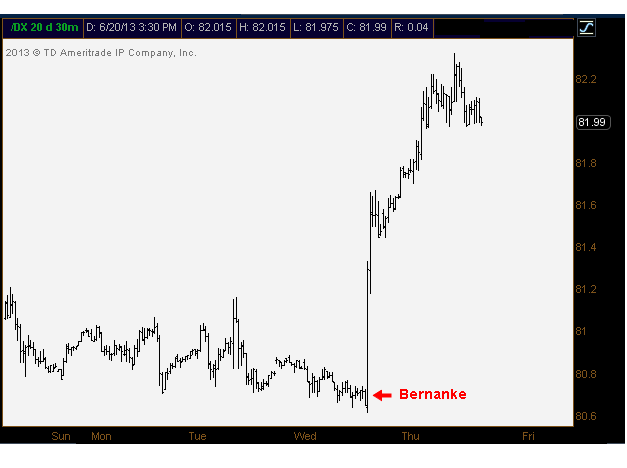
There aren’t many places to hide in these intermarkets. They haven’t bought the Yen and Treasury bonds like they did during the 2008 crash. They’re only buying US Dollars.
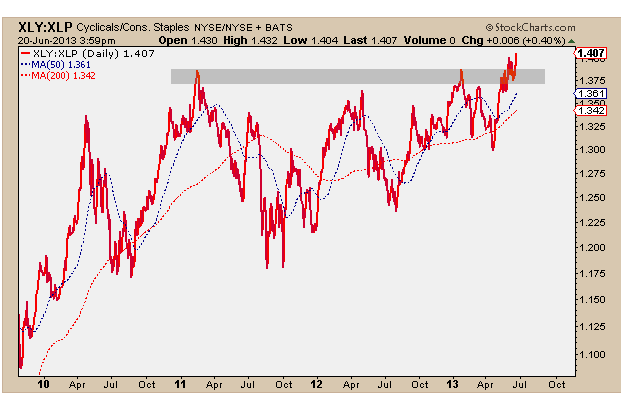
It will be interesting to see who among the 3 bounces first, and how long that bounce lasts. My guess is they buy bonds before the other two, but that’s just my educated guess, we don’t have a position on. We’re continuing to stay as market neutral as possible. Low/zero correlation pairs are still what’s working best for us. If it ain’t broke don’t fix it right? So we’re going to stick with that theme for now. I like this Long Discretionary / Short Staples spread ($XLY $XLP) as it closes at multi-year highs. As long as these fresh highs hold, it seems like they want to take them higher. I was impressed today seeing the relative strength in this particular pair in the face of a global meltdown.
So overall I think this market selling off is a good thing. I’m happy to see it. Too many people have been making too much money far too easily. Reminds me a lot of the conversations that I would have with $AAPL shareholders before last September. The lazy shareholders that never sold and didn’t use stops got destroyed. And it may sound like I’m being mean, but they deserved every penny the lost. Same goes with market participants who aren’t disciplined these days in taking losses when their wrong. The gold bugs are a great recent example of that. And we’ll have more of these examples in the future, I can promise you that…
Discipline. I think that’s what important. It’s not always easy, but it’s necessary.
Tags: $SPY $UUP $DJP $CRB $TLT $TNX $DX_F $GLD $GDX
This is still the 1600 chart I’m watching in the US stock market. To me this is the big line before getting all excited on the short side of the US. Nothing wrong with keeping it simple here.
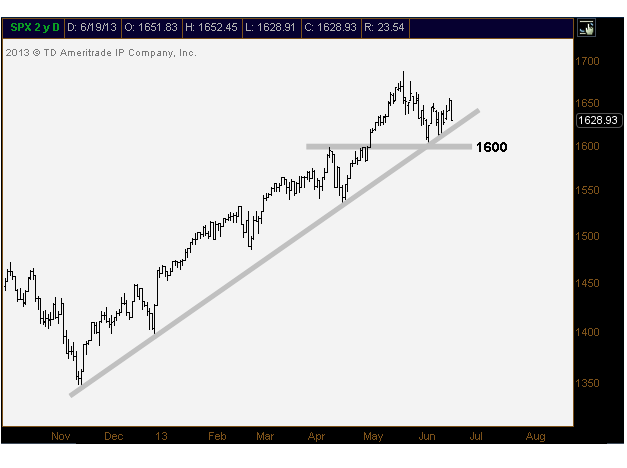
Now, are we more vulnerable than ever to break down and finally join the 2013 global market meltdown? Sure. But it doesn’t matter what I think. Let’s see price tell us.
What are you guys looking at?
Tags: $SPX $SPY $ES_F
My friend Ari Wald sent over a great chart yesterday showing some extreme readings coming out of the Put/Call ratio. This technical indicator measures investor sentiment by calculating the ratio between all put options and all call options purchased on a given day. A lower reading below 0.6 generally represents complacency among investors, while readings above 1.0 show that fear is in the market and can historically be taken as a bullish signal.
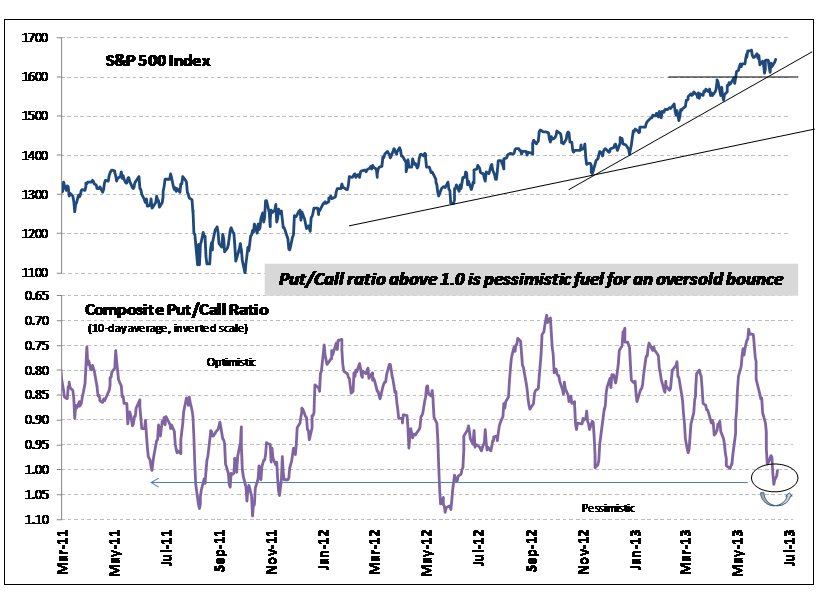
Ari does a nice job smoothing the ratio by using a 10-day average to clean out some of the noise. The chart is also inverted to better show bullish & bearish signals. He had this today regarding the data:
“Pessimistic Put/Call data indicates dry powder for a bounce: From a trading perspective it has become incrementally bullish that previously ebullient sentiment has receded over the course of the last month. Specifically, the 10‐day composite Put/Call ratio is above 1.0 from mid‐May readings near 0.7. Such stretched positioning indicates that there is dry powder to support a continuation of the S&P 500’s bounce from its 50‐day m.a. should investors react favorably to potentially dovish Fed comments. Any such bounce faces resistance at 1687, and, in our view, would likely be part of a multi‐month period of consolidation”
Last time we hit such extreme levels of pessimism in the ratio was last summer, which sparked a 16% rally in S&Ps over the next 3 months. The time before that was in the Fall of 2011. The market rallied 30% over the next 5 months. Will history repeat?
Make sure you’re following Ari on Stocktwits & Twitter @AriWald
Source:
Princeridge Technical Strategy (June 18, 2013)
Tags: $SPY $SPX
It’s hard to ignore all of these flag patterns developing around the market these days. They call them flags because the price pattern that develops after a move higher and then a sideways consolidation appears like a flag pole and flag. Usually these are continuation patterns that resolve themselves in the direction of the underlying trend. But we still need to keep an open mind.
Here are a two examples in Tech and Financials, but we’re seeing them all over in different sectors, sub sectors and major averages:
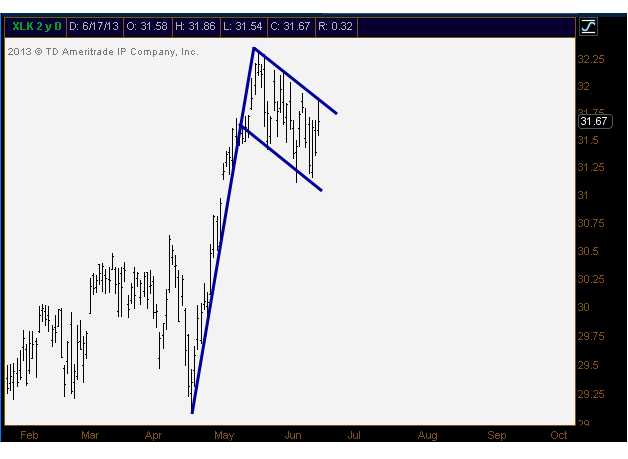
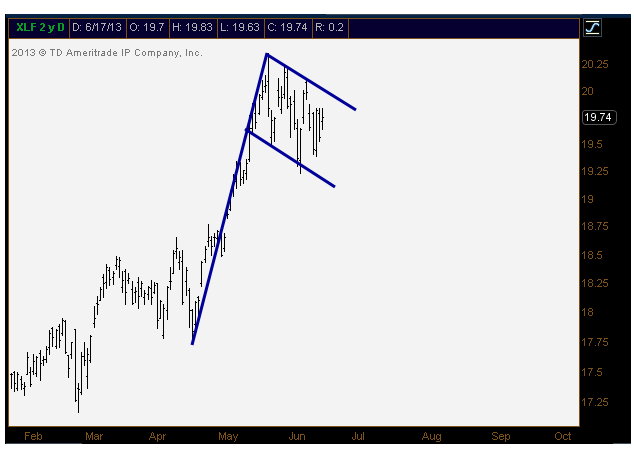
In some cases the patterns are more like pennants with converging trendlines instead of parallel lines like up above (Industrials and Discretionaries for example look like pennants). But regardless of a flag or pennant, both have similar ramifications. So if these indeed are continuation patterns, then we want to start to see the downtrend lines from the highs get taken out for confirmation. We’ve seen these patterns roll over in the past, like in Copper last September for example, so it’s important to always keep an open mind.
Interesting setups nonetheless…
Tags: $XLY $XLK $XLF $XLI $HG_F
This is something we’re noticing that isn’t getting talked about much. Why are so many speculators piling on to the long US Dollars trade? And why is this breakout in the Euro happening so quietly? Last week we saw the highest levels in $EURUSD since February. I bet if it was the other way around and Euro was hitting 4-month lows we would certainly be hearing about it. But it’s the US Dollar hitting fresh lows. And this is all while small speculators have their largest net long positions in a decade.
Here is the US Dollar running into resistance last month up near last year’s highs. We’re noticing similar characteristics in both dollars and euro that we saw last summer (see here and here). As the dollar index made new highs in May, momentum was already rolling over and making lower highs:
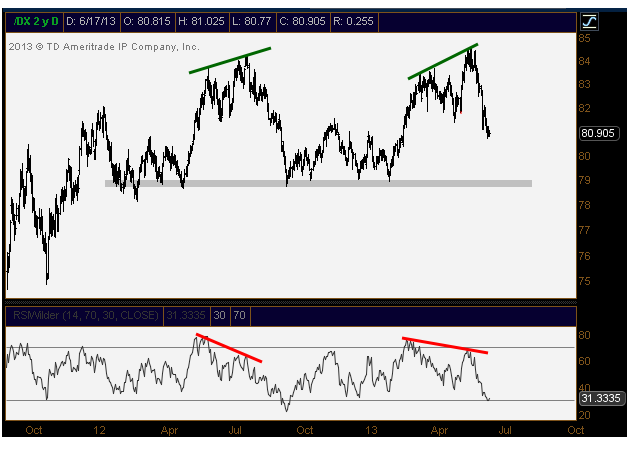
And this is all coming while the commitment of traders report is showing that speculators have big bullish expectations. Not a good combination if you ask me. Let’s see what happens.
Tags: $EURUSD $FXE $UUP $DX_F
We just finished up with another down week for the S&P500. That makes 3 out of the last 4, which hasn’t happened since November. The 20 day moving average hasn’t been declining this long since November either. So we’re seeing some new things for sure. But no confirmed breaks just yet.
Dr. Phil and I recorded our weekly chat and discussed those levels we’re watching in S&Ps. But also the big break down in China this week, Crude Oil’s potential breakout as well as the possibility of another leg down in gold miners. Check it out:
Tags: $USO $CL_F $SPY $FXI $EWC $SPY $GDX