I had to put this video up. Great stuff.
Barry Ritholtz chats with Jeff Macke on Yahoo Breakout:
Click on ![]() for full screen.
for full screen.
Source:
Expert technical analysis of financial markets by JC Parets
I had to put this video up. Great stuff.
Barry Ritholtz chats with Jeff Macke on Yahoo Breakout:
Click on ![]() for full screen.
for full screen.
Source:
Shares of $DELL are up a little this morning after last night’s announcement that they are repurchasing $5 Billion worth of Stock. In this age of innovation these guys really couldn’t think of anything better to do with their cash than buy back their garbage stock? Really?? Talk about putting good money after bad.
Look at this chart – the bottom of it shows the performance of $DELL shares relative to the S&P500 ($SPX). What a disaster this has been. Good market or bad market – $DELL consistently underperforms.

I see no reason to buy this stock, yet. The first thing we want to watch for is some sort of out-performance. If we see penetration above this declining trendline in the $DELL:$SPX ratio, then we’ll watch a little closer. The next thing that we want to see is the stock get back above this trendline that was broken on the price chart. Since the bottom in 2009, $DELL had been making higher lows and higher highs but recently broke below that trendline.
Looking out into the future, there is a defined level of resistance right around $17.50. Break through there and hold it and then come talk to me. Meanwhile, go check out what some of these analysts had to say this morning: $GS says to sell it, $UBS is somewhat indifferent, and Barclays and Merlin also had some comments. See the WSJ article for more.
Source:
One of our must-watch leading indicators is the Monthly Retail Sales Index. The U.S. Census Bureau announced today that retail sales were flat from July to August but up 7.2% from August 2010.
Retail sales are now up 17.1% from the bottom, and 2.9% above the pre-recession peak.
Here is the chart via Calculated Risk:

Source:

Is the US Becoming ($EWJ) Japan (Ritholtz)
Altera ($ALTR) forms Big Bullish Engulfing Pattern (StockChartsBlog)
Copper ($JJC) Says the Markets Still Suck (DragonflyCapital)
$GLD $GC_F – Richard Russell: Not So Fast Gold-Haters (KingWorldNews)
Stock Market Video Analysis with Brian Shannon (Alphatrends)
$SPX – Bias and Options Expiration Stats (Attitrade)
Video: Carter Worth Says 950 is Just Not in the Cards (CNBC)
Greek Credit Update: 1 yr, 2 yr, 10yr (PragmaticCapitalism)
Volatility ($VIX) ETNs Piling Up (WSJ)
International Government Long-Term Interest Rates (Bespoke)
Facebooks ($FBOOK) Unbelievable Domination of our Time on the Web (SAI)
When discussing small business sentiment, the words “Crashed” and “In the Tank” are not exactly what I want to hear. The National Federation of Independent Business (NFIB) used these terms to describe what happened to small business optimism in August.
From Business Insider:
“Confidence in the future of the economy crashed in August, taking the Small Business PESSImism Index down 1.8 points to 88.1. This was the sixth monthly decline in a row. The expansion is officially two years and two months old, but the small business half of the economy is still in the “tank”. Expectations for real sales growth and business conditions were the major contributors to the decline for the second month in a row.”
Here is the updated chart via Calculated Risk:

Hiring plans were still low in August, but positive and improving. According to NFIB: “A seasonally adjusted net 5 percent of owners planning to create new jobs, which is a 3 point improvement over July.”
So we have that going for us.
Sources:
Small Business Economic Trends (NFIB)
Small Business Sentiment “Crashed” In August (BusinessInsider)
NFIB: Small Business Optimism Declined in August (CalculatedRisk)
Mary Ann Bartels and Stephen Suttmeier, Technical Analysts at Bank of America, wrote in a report today that the S&P500 may slump as much as 21% as volatility on the benchmark measure continues. A low of 910 on $SPX is not out of the question, according to the analysts.
Here are a few quotes from the Bloomberg article:
“We are more concerned now that the downside risk could be more than we originally forecast,” Bartels and Suttmeier wrote. “Measured moves suggest 985-910 on the S&P 500 is a potential range where a market bottom may finally be found.”
“We expect several more months of volatility and once a bottom is made it will take months to build a base to repair the equity market — this could carry over into 2012,” Bartels wrote. “The violent swings within the market are more typical of a bear market than a bull market. We suggest using rallies to raise cash and or become more defensive until our trip wire to a bottom generates a buy signal.”
Here is the S&P500 chart going back to the beginning of the bull market. I included the Fibonacci retracements to help put $BAC ‘s analysts targets into perspective:
 $SPX $SPY $ES_F
Source:
S&P500 May Plunge 21%, Bank of America Says (Bloomberg)
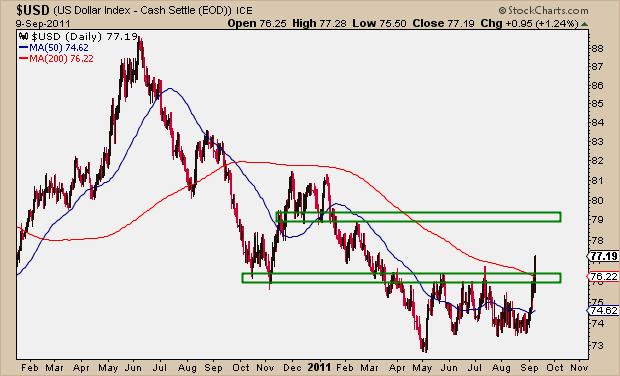
With all of the excitement over the pre-market action this morning, the US Dollar Index is flat so far. Stocks are making big moves, but the Dollar seems to be digesting last week’s breakout. After basing for about 4 months and breaking the downtrend line going back to last summer’s highs, the Dollar Index is up to the highest levels since March.

I would not be surprised to see the Dollar roll over (I’ve seen it happen too many times). But if it can hold on to last week’s gains, you’re looking at the next target just above $79 where we run into support levels from late last year and resistance from February. $81 after that if this is indeed a major move. The Big picture in the dollar has not changed and I think the major trend is still lower (been going down for 10 years). But we could potentially see a cyclical rally in the opposite direction as money flows to the Dollar as a safe haven.
I’m watching $76 to be on the safe side. If the dollar breaks below that, I think new lows will be made.
$UUP $DX_F $USDX
The outlook for Greek here is almost completely unknown. Mike Shedlock notes this morning that yields on the 1-year hit 108% and Calculated Risk is reporting highs of 112% earlier today. Look at this chart:

See Also:
Europe: Greek 2 Year Yield Hits 64% (CalculatedRisk)
Please Germany, Get this Over With Already (BigPicture)
Europe Continues to Tumble As French Banks Hit Hard On Greece Default Idea (FundMyMutualFund)