I was down at the Nasdaq on Tuesday morning chatting with Frances about the recent action in the coal sector. This is a hated group, which I love. So it’s something we’re following very closely.
It was a short segment today:
Source:
Expert technical analysis of financial markets by JC Parets
I was down at the Nasdaq on Tuesday morning chatting with Frances about the recent action in the coal sector. This is a hated group, which I love. So it’s something we’re following very closely.
It was a short segment today:
Source:
I’ve been obsessing over this Coal chart for the last few months watching this healthy consolidation take shape. I first pointed out this development in March, and although we were up a few percentage points since then, it wasn’t really until last week that we finally got going. The bigger the base, the stronger the breakout tends to be. In the case of coal, we had 4 months of a tight consolidation. I love that.
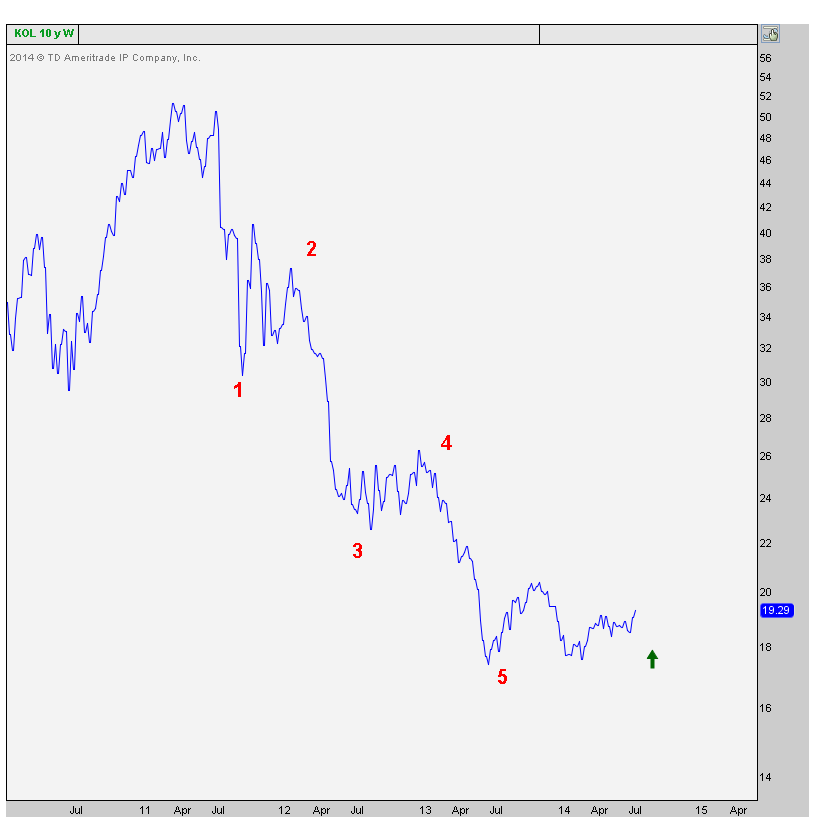
Just to review what’s just occurred, let’s go over the thought process behind the trade. The first thing that stands out is the overwhelming anecdotal evidence of hatred towards the coal stocks. Who’s pounding the table on Coal? Very few if any. Second of all, I’m not a pure Elliottician, far from it, but I’m not blind to a beautiful five wave pattern either. We have that here in $KOL and often times a solid bounce develops from the end of a 5-wave move like this. The 3-of-3 is text book:
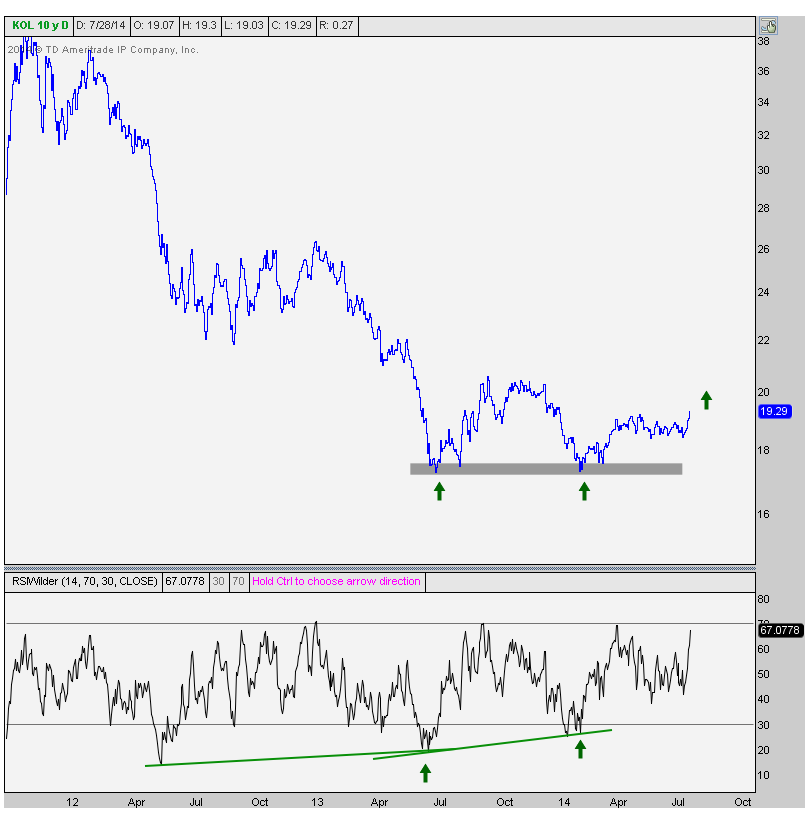
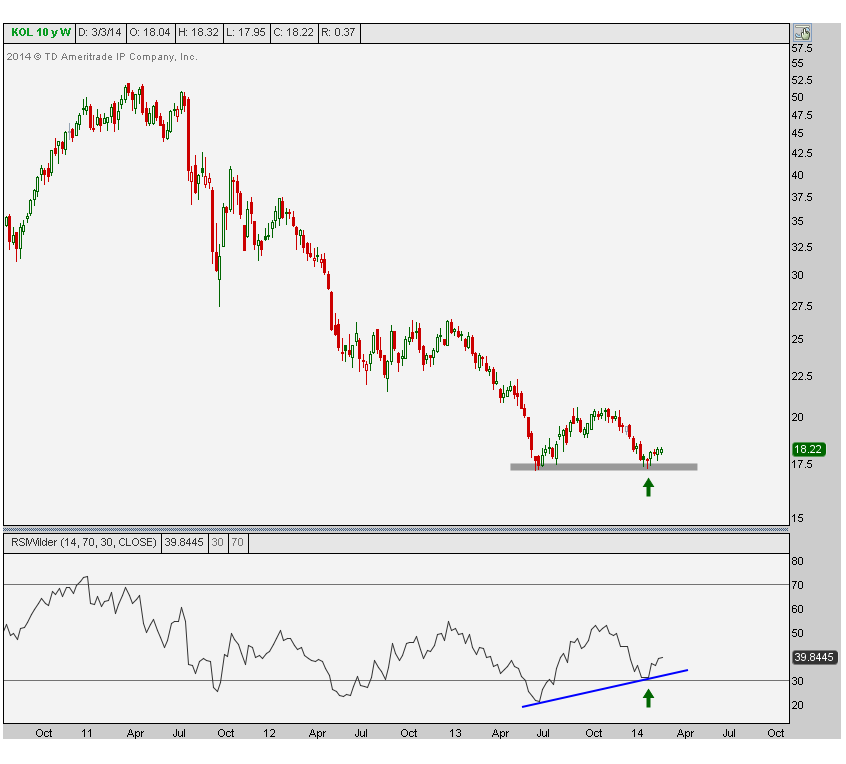
So Elliott wave tells me to pay attention and sentiment says to pay attention. Okay, now you have my attention. What is momentum doing? Well, here is the daily chart of KOL showing a massive bullish divergence developing. This is not just at last summer’s low, but once again on the retest of that low earlier this year. Some might even call this a double bottom, but that won’t be confirmed until we take out 20.50, which are last Septembers highs. So although not really relevant yet, the potential is certainly there:
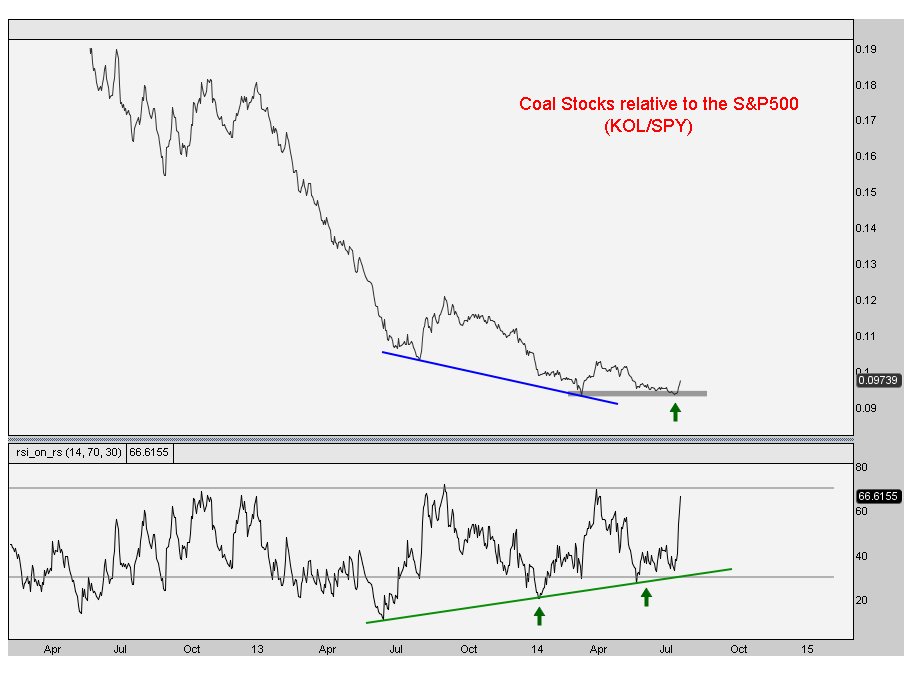
Wow, so momentum looks great. Is the relative strength also improving? Not only is it improving, but we have bullish divergences in momentum on the relative strength daily chart as well as the weekly. That combination reminds a lot me of Apple’s epic top in September 2012; we had the same thing. Look at this weekly chart of KOL/SPY showing the improvement in relative strength:
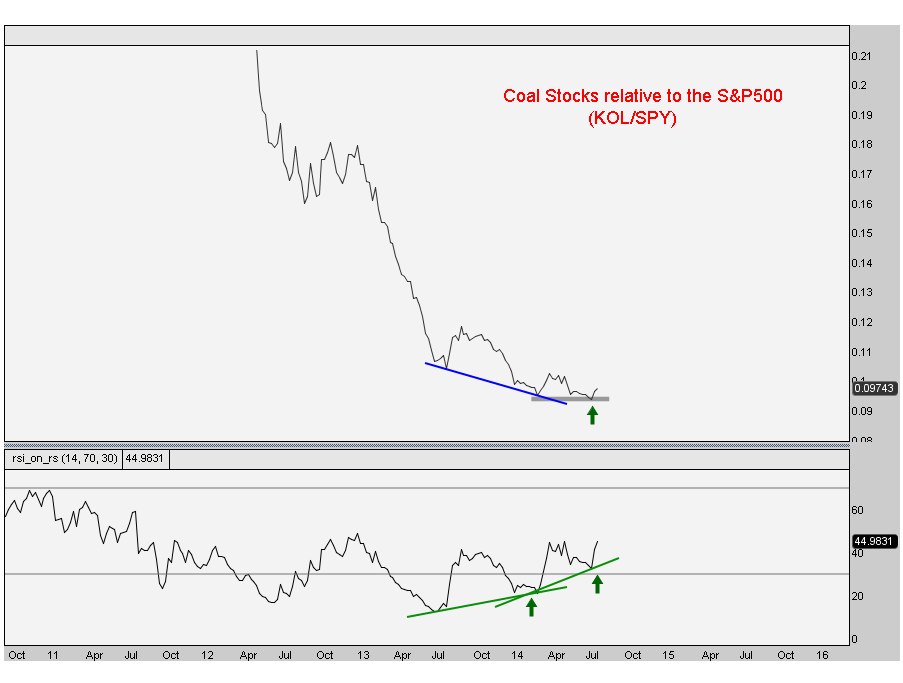
Now look at the daily chart. Nice right?
Check. Check. Check. Check. Now what? We wanted to see a breakout in price right? Well we just got it:
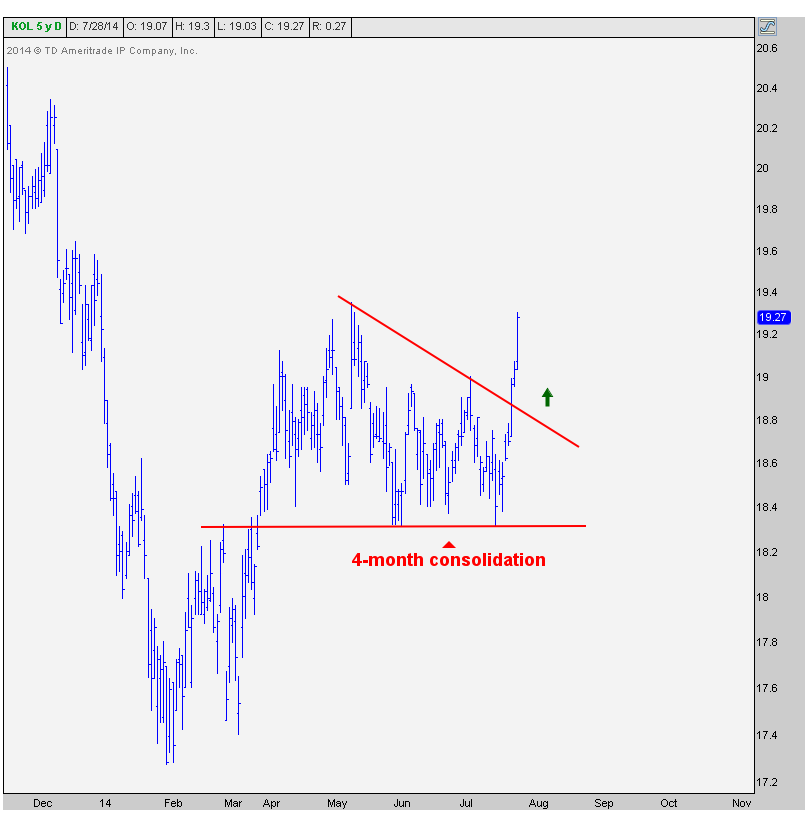
Looks great to me. We only want to be long above this 4-month consolidation. If it falls back into it, then the chart is not as clean. I only like clean charts. Funny we’re talking about coal in this way, the dirtiest of energy sources.
Love it. The first target is $26; the highs from 2012, which in my opinion was wave 4 of the 5-wave declined that first got my attention. Take a look at the $KOL holdings and there are some more interesting setups in there as well. Look at a name like $CLF where 35% of the float is short, it has a 10 day short ratio, and only 4 of the 24 sell side analysts who cover it have a buy recommendation on it. We really love that. Do a little homework and you’ll probably find more of them in a similar situation.
I think this is a great example of incorporating many of our tools to come to form conclusion. I know I’ve mentioned this trade a few times recently, but figured that going over the entire thought process could add some value. I hope I accomplished that.
Go get ’em!
***
REGISTER HERE for more information on how to access these price and relative strength charts for all sub-sectors on a weekly basis.
Tags: $KOL $SPY $CNX $JOY $WLT $ACI $CLF
Whenever I bring up coal stocks to my smart friends, they laugh at me and tell me to order another drink. I kid you not. I’m lucky that I live in New York City and get to hang out with some of the smartest minds in the business. I’ll never take that for granted. But anecdotally, it allows me to throw out feelers on some of my ideas and get feedback on what I’m thinking. It’s funny, no one I know agrees that coal stocks look interesting here.
So we can start there. It’s not data driven evidence of hatred, but through my experiences I can’t say it’s not a good starting point. The reason I’m bringing it up today is because of the incredibly tight consolidation taking place since March. Almost five months ago I put up a note suggesting it was time to own Coal stocks for a variety of reasons. Since then, the $KOL exchange traded fund is only up 2-3%, but it’s the consolidation that’s taken place since then that really gets me excited.
Look at this weekly chart of $KOL. It’s rare to find a tight range like this for such a prolonged period of time. We’re going on almost 4 months of this action:

The best way to execute, in my opinion, is to wait for the breakout. Eventually, there will be a resolution. In my opinion it’s going to be to the upside, which could present a monster rally that would return 40-50% in a very short period of time. I would consider a confirmed breakout to be a weekly close above any of these others 19-19.15ish. It really all depends. I would love to see a gap higher out of this range. Some might call it a, “gap and go”. It’s hard to predict at this point. But this consolidation can’t be ignored. Epic moves have been born out of this type of pattern. So I’m waiting patiently.
I thought it would be prudent to bring up this recent development. It has nothing to do with who our president is or who he isn’t, it has nothing to do with alternative energies and even less to do with any geopolitical turmoil. This is strictly based on supply and demand dynamics. And looking at this chart, if demand can exceed supply just enough to break this out of it’s range, look out!
***
REGISTER HERE for more information on how to access updates on this chart on a weekly basis
Tags: $KOL $CNX $BTU $JOY
Whenever the word “Coal” comes up in conversation, a reaction of disgust has become the standard. The reasons range from, “It’s dirty” to, “We don’t need it” to, “Obama” (whatever that means)…..But I don’t know anyone who likes this space. Not a single person in fact. I bet I probably grossed some people out with this headline alone.
So as we like to do around here, when no one likes them it’s probably time to look a little bit closer. We’ll focus our attention today on shares of the Market Vectors Coal ETF $KOL. The first thing that stands out to me is the beautiful 5-wave pattern from the 2011 highs down to last year’s lows:
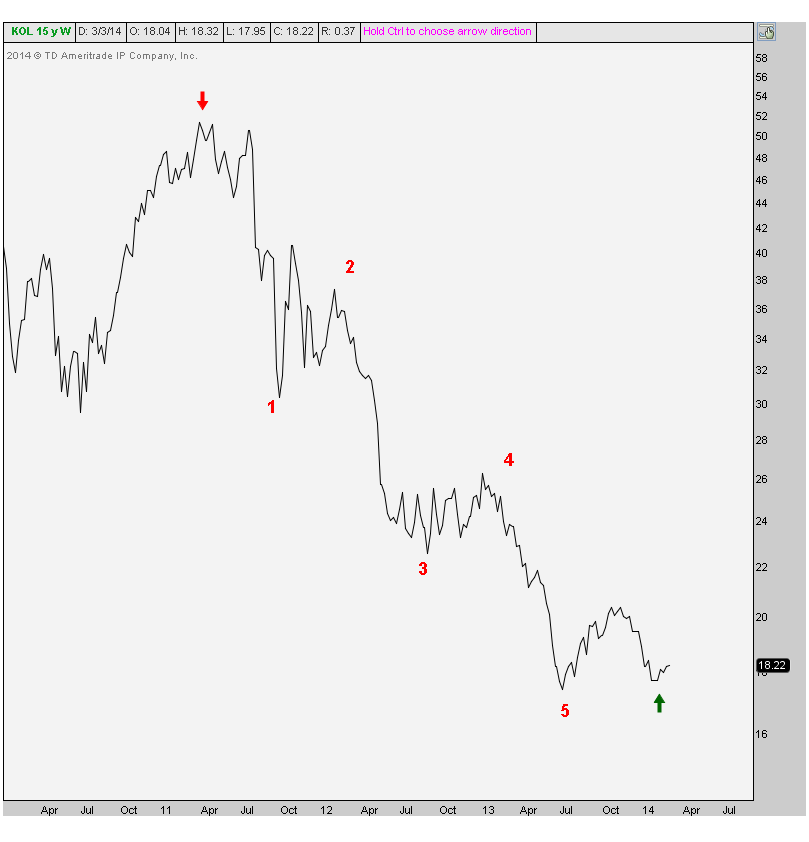
The next thing that sticks out to me is the potential double bottom formation down here near 17.25. This is a weekly candlestick chart. Look how on the second low last month, momentum (measured using a 14-period RSI) was putting in a much higher low. That bullish divergence stands out after a 5-wave decline.
I’m not a hard-core Elliotician. I find it too difficult and too subjective to sit there counting every single wave on every time frame. That doesn’t make much sense to me based on my time horizon and strategy. But I can’t help but notice something when it’s right there starring at me in the face. Trends tend to move in waves of 5. After a beautiful 5-wave downtrend, it would not surprise me one bit to see a nice recovery.
Remember, we don’t need a massive new uptrend. A correction of this 3-year downtrend could be violent. If the coal names just get back to the highs from a year ago, we’re looking at a 50% move. I don’t care who you are, that’s a lot. And what’s the risk? Well if prices make new lows, then we know we’re wrong. That presents us with about a 1:10 risk/reward opportunity. Anything wrong with that?
So why would coal stocks start rallying from here? Simple: who care why. Knowing why doesn’t pay us, never has, never will. And please don’t be that guy that compares it to Natural Gas. I know it sounds good on tv, but the math isn’t there. So please don’t….
I will say this though: look around. Who do you know that’s bullish on the coal names? I talk to a lot of people and I don’t know anyone. Do you?
Tags: $KOL $CNX $JOY $BTU
Tradition has it that if you misbehave throughout the year, you might just end up with a lump of coal under the tree on Christmas morning. But going into the end of 2012, it might not be such a bad thing. In case you hadn’t noticed, the Coal sector has been consolidating in a nice tight range for almost 7 months. These narrow ranges typically resolve themselves with a vicious move one way or another. We’re in the camp that this resolution comes with a move higher.
Here is a chart of the Market Vectors Coal ETF ($KOL) in a tight range since May. The first thing that stands out to me here is the higher low that momentum was putting in as prices were making fresh 52-week lows in September. This bullish divergence in the relative strength index is clue number one for higher prices:

Next, we need to factor in the amount of attempts that Coal has made to get above this $26 level. It’s more of a 50-60 cent range and not an exact number, but the resistance is clear. Currently, this space is working on a 5th test of that resistance. As always, the more times that a level is tested, the higher the likelihood that it breaks.
From a risk management perspective, I’d be looking at November’s lows. We really should hang on to those if $KOL is going to breakout to the upside. A rollover there would signal to us that this space isn’t ready yet and needs some further consolidation.
So we’re watching Coal pretty closely here, and more specifically the components of the ETF itself. I think it pays to dig deeper into this space and maybe get creative with positioning and entry points. As we approach the end of the year, we’re looking at some of the areas of the market that could turn into leaders. We mentioned China recently, and I think Coal should follow that space.
Tags: $KOL $BTU $CNX $JOY $$YZC