At the end of every month, we rejoice. Regardless of the market sentiment, we rejoice. When the market closes, we rejoice.
That’s a lot of joy one would say. But here we hold monthly charts in high regard. The exercise of going through monthly charts is therapeutic in a way that it helps you zoom out and get out of short-term messes. This is that time of the month when trends become clear.
As the month of March begins, we’re here to perform the same exercise.
Read on to know what the market is saying.
We are in a market environment that is drastically different from what we saw in 2020. Human tendency is to recall the most recent event and give progressively less value to the events prior to that. Similarly, the 2020 market recovery is viewed as the best time and 2021 became a ‘difficult year’ for market participants. But just as we do in our analysis, everything is relative. 2021 was only relatively bad. If you pick up stocks that performed well, your portfolio would’ve performed well in 2021 as well.
The market that we’re in today is one where the index may continue to struggle, but the stock-specific performances will take the spotlight.
But here, we’ve come to discuss the big picture. So let’s get on with it.
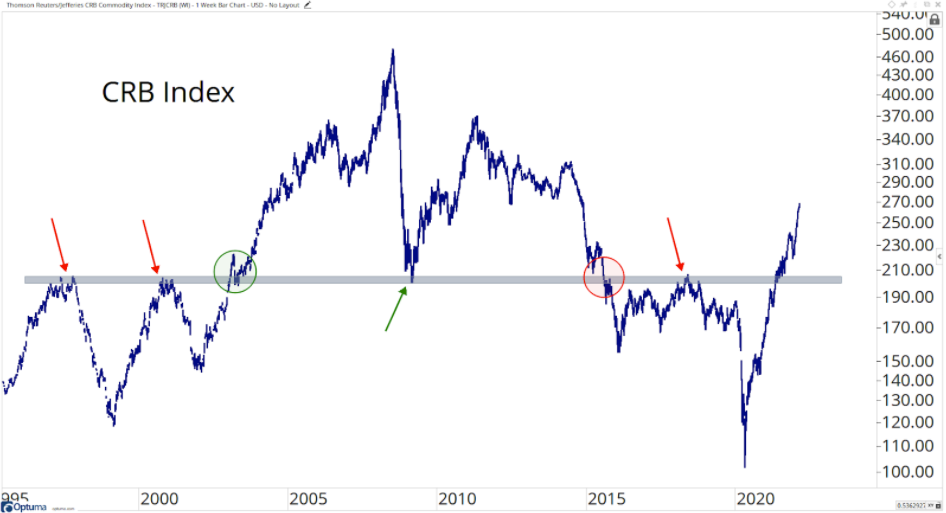
The first chart we’re interested in pointing out is possibly the best and most important chart to track on a global level.
Here is the CRB Index making new 7-year highs. We’ve been talking about the trend in Commodities has been clear and this is it right here! You can see where this trend is headed. There are certainly no signs of a halt in this current trend. So in its current state, this trend is here to stay! Sure a major chunk of the CRB Index is Crude Oil, but we’re seeing a good move there for a while now!
To access our team’s Technical Analysis, you must be a premium member of All Star Charts India. Please login below or start your risk-free 30 day trial today.
Lost Password?