CHART TYPES
🔍 Why Use Indicators?
Indicators help us quantify patterns, momentum, and potential entry and exit points. They’re tools that aid analysis—not magic signals. The real value of indicators lies in how you apply them based on your strategy and personal approach.
🧩 Popular Indicators & Their Uses
Moving Averages (MA)
Purpose: Moving Averages (MAs) are used to smooth out price fluctuations, making it easier to identify trends over time. MAs highlight the general direction of a market, filtering out short-term price noise.
Types:
1.Simple Moving Average (SMA):
- Calculation: Adds the prices over a set period (e.g., 50 days) and divides by the number of periods to get an average.
- Characteristics: Gives equal weight to all data points, which makes it less responsive to sudden price changes. This is ideal for seeing a clear, general trend.
2. Exponential Moving Average (EMA):
- Calculation: Applies a weighting factor, making recent prices more impactful than older ones. The formula uses a multiplier to calculate each day's EMA based on the previous EMA and current price.
- Characteristics: EMA reacts faster to price changes, making it more useful in volatile markets or for short-term analysis.
Key Strategies:
1. MA Crossovers:
- Golden Cross: When a shorter MA (e.g., 50-day) crosses above a longer MA (e.g., 200-day), it signals a possible uptrend, often seen as a buying opportunity.
- Death Cross: When a shorter MA crosses below a longer one, it signals a potential downtrend, indicating a possible selling opportunity.
- Interpretation: Crossovers work best in trending markets, and are less reliable in choppy or sideways conditions.
2. Support and Resistance:
- Dynamic Levels: MAs can act as "moving" support and resistance. In an uptrend, price often finds support at the MA line, particularly for a 50-day or 200-day MA. In a downtrend, MAs may act as resistance levels.
- Trend Confirmation: When price stays above an MA, it confirms a potential uptrend, while staying below may confirm a downtrend.
3. Length Selection:
- Common Lengths: Traders typically use the 50-day and 200-day MAs for long-term analysis, and shorter periods like the 9-day or 20-day for short-term trends.
- Adapt to Strategy: Longer periods provide more reliable signals but are slower to respond, while shorter MAs are more sensitive but can give false signals.
Momentum
Purpose:
Momentum indicators assess the strength and speed of price movements, offering insight into whether a trend is likely to continue or reverse. They help in identifying overbought or oversold conditions, signaling potential trend changes.
Types:
1. Relative Strength Index (RSI):
- Calculation: Compares the average gains and losses over a specified period (usually 14 days) to produce a value between 0 and 100.
- Characteristics: RSI values above 70 suggest overbought conditions (potential for a pullback), while values below 30 indicate oversold conditions (potential for a bounce). RSI is commonly used to confirm trend strength or spot divergence patterns in price action.
2. Moving Average Convergence Divergence (MACD):
- Calculation: Derived by subtracting the 26-period EMA from the 12-period EMA. A signal line (usually a 9-day EMA of the MACD line) is plotted alongside to generate signals.
- Characteristics: MACD identifies trend changes through crossovers (when the MACD line crosses the signal line) and can highlight potential entry or exit points. The MACD histogram, which shows the distance between the MACD and signal lines, indicates momentum strength.
Key Strategies:
1. Bullish and Bearish Ranges:
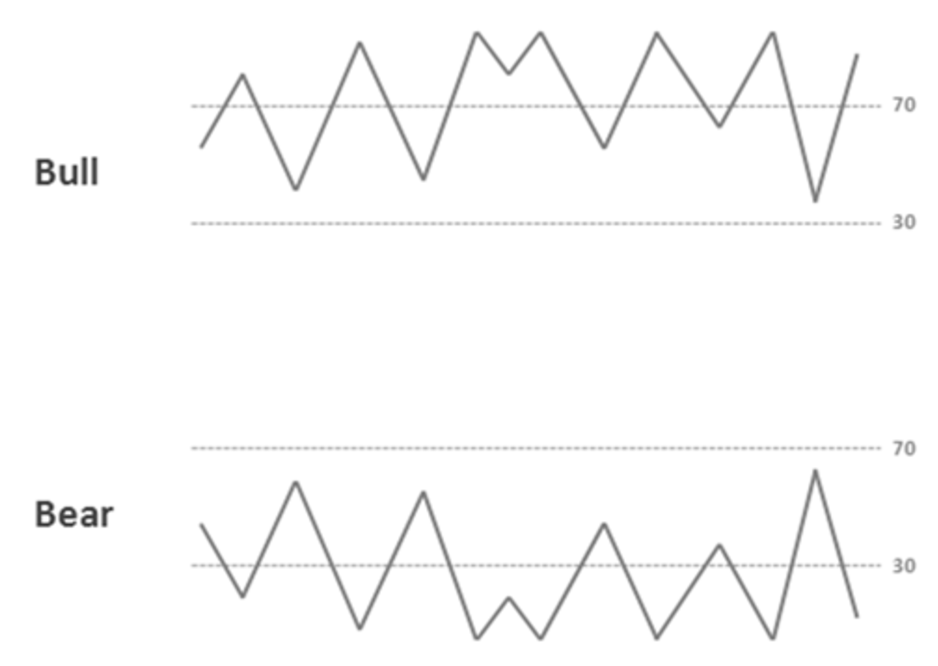
- RSI Bullish Range: In an uptrend, RSI often remains above 40, peaking above 70 during strong moves. This sustained strength signals continuation of an uptrend.
- RSI Bearish Range: In a downtrend, RSI typically stays below 60 and dips below 30, indicating selling momentum and a potential continuation of the downtrend.
2. Divergences:
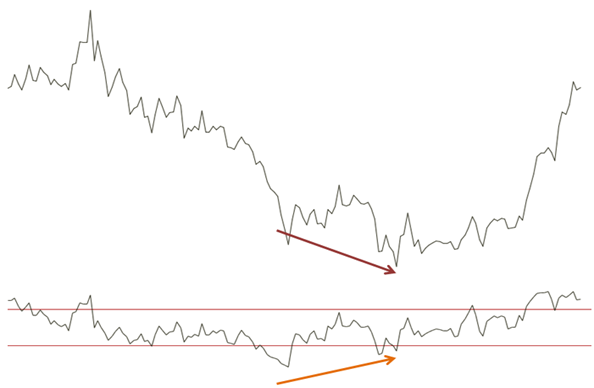
- Bullish Divergence: Occurs when the price makes a lower low while RSI or MACD forms a higher low, suggesting weakening selling pressure and a potential reversal to the upside.
- Bearish Divergence: When the price makes a higher high but RSI or MACD makes a lower high, it signals weakening buying momentum and a possible reversal downward.
3. Overbought and Oversold Levels:
- Interpretation: While RSI above 70 is generally considered overbought and below 30 is considered oversold, these levels are not absolute. In strong trends, RSI may stay in overbought or oversold territory for extended periods. Adjusting the thresholds (e.g., 80 for overbought in strong uptrends) can provide more context-specific insights.
Fibonacci Analysis
Purpose:
Fibonacci Analysis is one of the most valuable and easy-to-use tools available to market participants. It helps identify potential support and resistance levels based on the Fibonacci sequence, which can be applied across all timeframes. By understanding these key levels, traders can make more informed decisions about entry and exit points, enhancing their ability to navigate both short-term and long-term trends effectively.
Types:
1. Fibonacci Retracements:
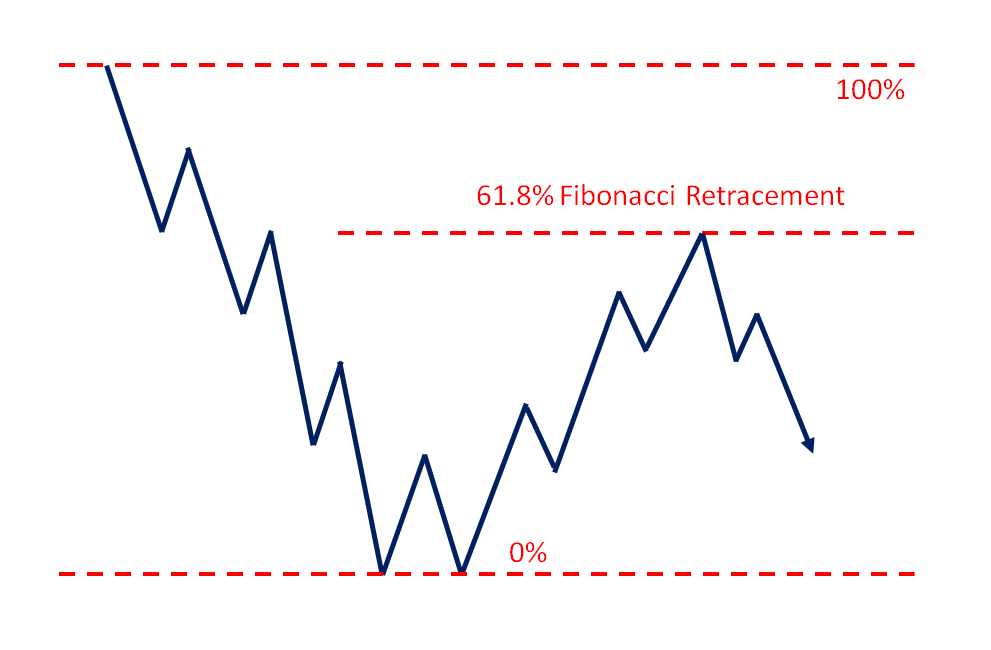
- Calculation: Fibonacci Retracements are drawn by identifying the high and low points of a significant price movement. The key Fibonacci levels (38.2% and 61.8%) are then plotted between these two points to identify potential reversal levels within the ongoing trend.
- Characteristics: Retracements are used to identify potential pullback levels within a larger trend. For example, in an uptrend, retracement levels can indicate where the price might find support before continuing higher. Conversely, in a downtrend, retracement levels can signal potential resistance before the price resumes its decline.
2. Fibonacci Extensions:
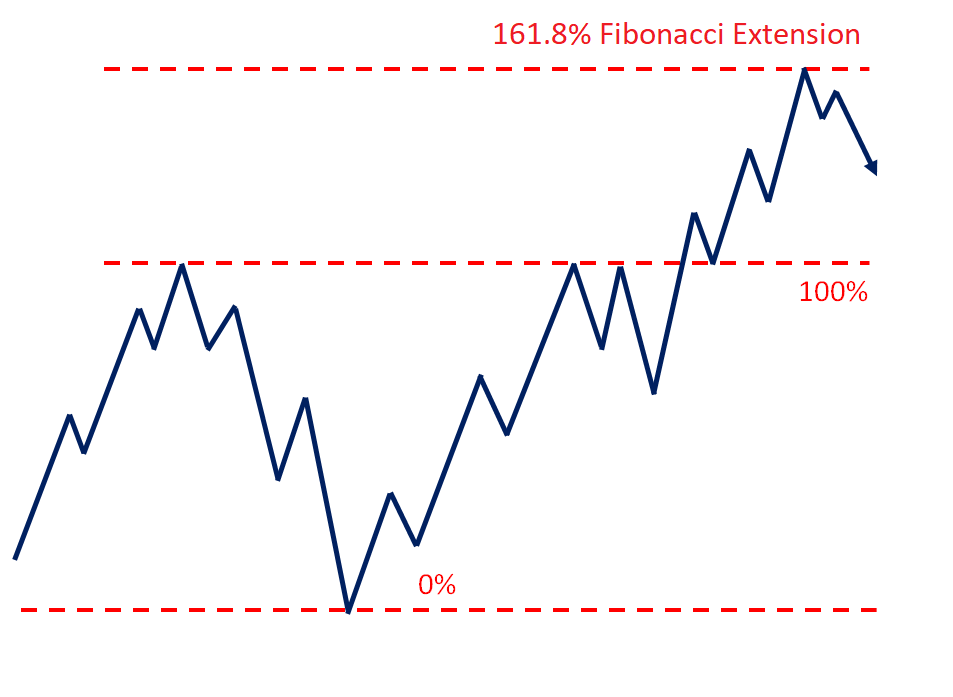
Calculation: Fibonacci Extensions are used to project potential price targets beyond the original high or low of a significant price movement. Common extension levels include 100%, 161.8%, 261.8%, and 423.6%. These levels are calculated by extending the Fibonacci ratios beyond the initial range used in retracements.
Characteristics: Extensions help traders identify potential areas where the price might face resistance or support after breaking out of a previous high or low. They are particularly useful in ongoing trends to set profit targets or to anticipate areas where the trend may lose momentum.
Key Strategies:
Retracements:
1. Counter-Trend Targets:
Retracements are primarily used to find entry points within a larger trend. For instance, in an uptrend, traders look for price pullbacks to the 38.2% or 61.8% retracement levels as potential buying opportunities, anticipating that the trend will resume.
2. Support and Resistance Confirmation:
When a retracement level coincides with other support or resistance indicators (like moving averages or previous price levels), it strengthens the significance of that Fibonacci level as a potential reversal point.
3. Fractal Nature:
Fibonacci Retracements can be applied to various timeframes, making them versatile tools. Whether analyzing daily, weekly, or intraday charts, retracement levels provide consistent reference points across different market conditions.
Extensions:
1. Ongoing Trend Targets:
Extensions are used to set profit targets in the direction of the prevailing trend. For example, after a breakout above a previous high, the 161.8% extension level can serve as a target for taking profits or setting trailing stops.
CUSTOMIZING
🖱️ Adding Indicators on TradingView
Moving Averages
Add Indicator to Chart:
Click the indicator button at the top of the screen and search "Moving Average Simple"
Customize Indicator:
Press the gear icon where it says SMA to change the period and color.
I use a 50 and 200 period on daily charts.
Make sure the calculation source is "close"
Momentum
Add Indicator to Chart:
Click the indicator button at the top of the screen and search "RSI"
Customize Indicator:
Press the gear icon where it says RSI to change the period and color.
I use a 14 period RSI over daily charts.
I don't use a moving average over the RSI.
Fibonacci
Add Indicator to Chart:
The Fibonacci indicator is not found under indicators, but rather the drawings tab.
You need to draw it from peak to trough on the price chart as shown below.
Customize Indicator:
You can double click the Fibonacci drawing to access the various settings.
I only use the basic 38.2% and 61.8% retracements and then the 161.8%, 261.8%, 423.60% extension levels.
That marks the end of Module 3!
🎯 Key Takeaways from Module 3:
- You now understand the key technical indicators
- You know how to interpret several indicators
- You've learned how to add the indicators on TradingView
- You know how to customize those indicators to your liking
💡 Quick Tip: Keep the indicators simple. Remember, just like the annotations in the previous module, indicators are there to help you understand price. Price action is the most important indicator.
🔔 Up Next: I'll give you a few days to absorb this information and from there we'll move to Module 4 where we'll explore setting alerts.