SCREENERS
🔍 What Is A Screener?
Screener's are perhaps one of the most important tools for traders and analysts.
With a few simple requests, you can easily see a list of assets (in this case, tokens) that fall within your desired conditions.
For instance, have you ever wanted an automatically updating list of cryptos that are:
- Near 52 week highs?
- Breaking out to new highs?
- Showing bullish momentum?
- Outperforming their alternatives?
The screener is how you can get this list.
CREATING THE SCREENER
🖱️ Finding the Screener
I use TradingView's Crypto Coin Screener for 90% of my crypto scanning.
You can find this by:
- Going to Tradingview.com
- Then hovering over Products > Screeners > Crypto Coins
- Or alternatively, by visiting Tradingview.com/crypto-coins-screener
Click on visual to enlarge view.
🖱️ Customizing the Screener
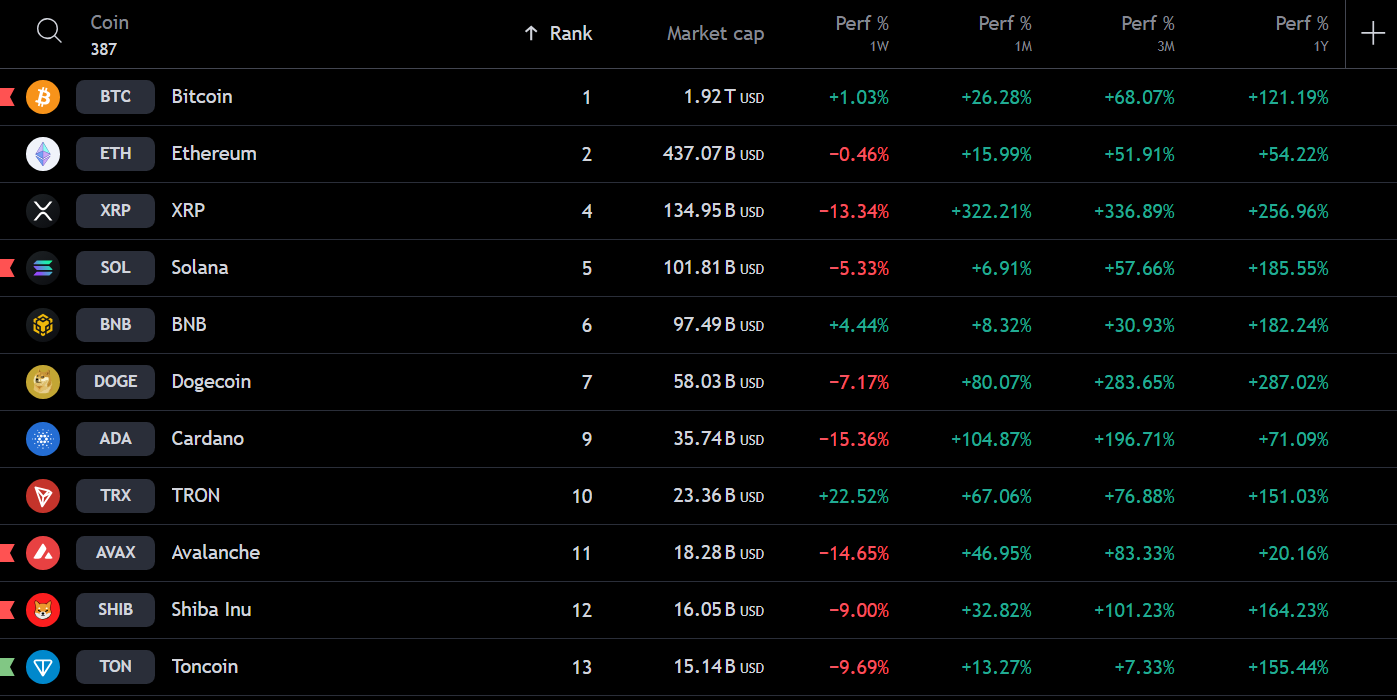
Let's firstly talk about how to setup the columns of the screener. Ignore everything else and just focus on the names of the columns and the "+" icon on the far right.
The "+" icon allows you to add new columns. They have a wide range of data points you can add:
- Market data
- Performance
- Volatility
- Volume
- Technicals
- Candlestick Patterns
- Indicators
- Momentum
- Sentiment
- Valuation
Click on visual to enlarge view.
I personally keep my columns very clean. I normally show:
- Coin
- Market-Cap
- Market-Cap Rank
- Performance
- 1 Week
- 1 Month
- 3 Months
- 1 Year
This is what most of my screeners look like. Again - very simple. Information overload is what we want to avoid at all times as traders and analysts.
Click on visual to enlarge view.
🖱️ Setting Up Filters
Now we have discussed the columns on the screener, let's talk about the filters.
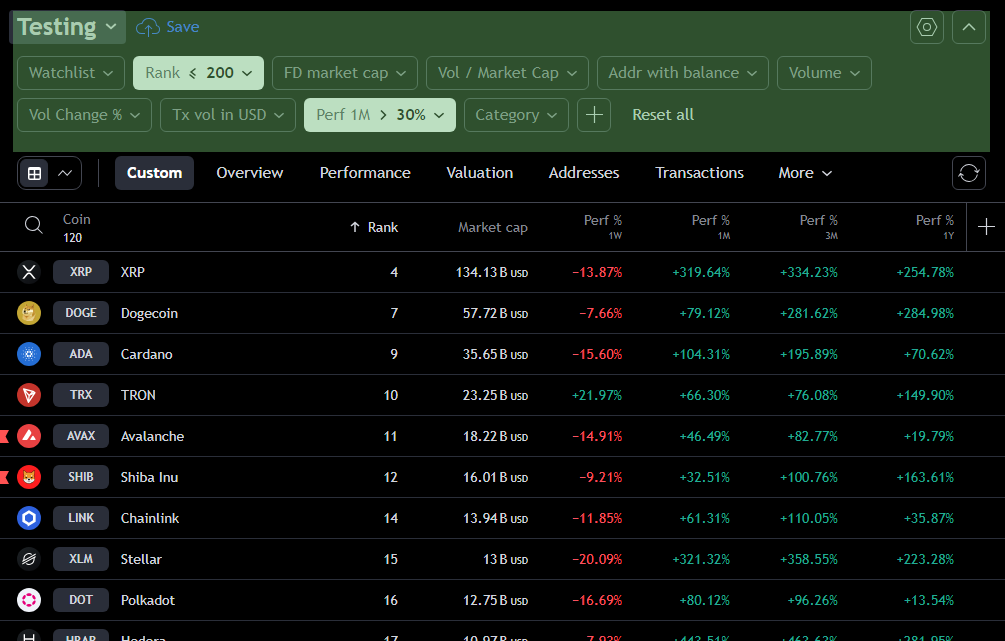
While columns determine what's displayed on the screener, the filter determines which coins are showed on the screener. When on the screener, the filters are these boxes highlighted in green.
You can organize your filters in whatever is appropriate for you.
For instance, in the below visualization I am screening for the top 200 largest cryptocurrencies that have returned more than 30% over the last month.
Click on visual to enlarge view.
There are a few screeners I run on a weekly basis.
- Scanning for new 52wk highs
- Scanning for new short term highs
- Scanning for the best performers over certain periods
🧩 Filters I Use
Let's put this theory to use and create a screen that scans for coins over $100M in market-cap that are close to their 52-week highs.
Step 1: Create new screen.
You do this by clicking the big text area in the top left and then pressing 'Create new screen...' (alternatively, you can press Alt + Shift + N).
Click on visual to enlarge view.
Step 2: Organize your columns
Remember how I said to keep the columns simple. I am removing the data sets I don't need (current price, volume, categories etc) and adding the data sets I do need (performance).
This is highly personal, so please feel free to experiment with what works best for you.
Click on visual to enlarge view.
Step 3: Add your filters
To create a market-cap filter, click the market-cap button and enter in 100M in the left to screen for all cryptos above $100M in market-cap. This filter helps us avoid cryptocurrencies that are too small or illiquid. If this filter is too low for you, you may want to try $1B instead.
To create a filter of coins that are near their 52-week highs, I add a filter by typing in price then creating a manual setup. Here are the settings I've used (30% seems like a lot, but in crypto it really isn't).
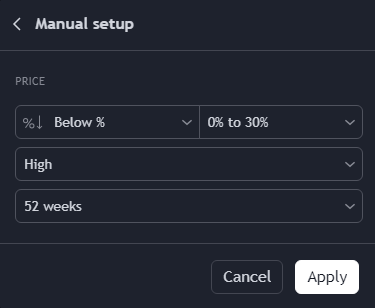
All in all, the below visual tracks how I set up these two filters.
Click on visual to enlarge view.
⚙️ Find Your Own Style
This part of our TradingView series is arguably the most complex. So if you don't fully understand how the screener works, that's all good!
I did title this the 'advanced tools' section, after all.
But what I encourage you to do is play around with the screener tool and see what works for you. Because at the end of the day, everyone's screener is their own; I like to keep mine as simple as possible to avoid information overload, but you may need these supplementary data sets.
And if you do get lost, remember I'm just an email away to help you move in the right direction!
That marks the end of our TradingView Mastery series!
🎯 Key Takeaways from Module 5:
- You now understand why screeners are so important
- You know how to setup and customize a screener to match your preferences
Progress:
- ✅ Module 1: Getting Started with TradingView
- ✅ Module 2: Charting Essentials and Drawing Tools
- ✅ Module 3: Using Indicators and Technical Analysis Tools
- ✅ Module 4: Setting Alerts and Managing Trades
- ✅ Module 5: Advanced Tools
💡 Quick Tip: Be patient with yourself. This is a lot of information, so it's okay to be a little overwhelmed. Dip your toes in and experiment; there's no pressure so have a little fun!