CHART TYPES
💹 Chart Types
Let’s talk about different types of charts.
There are 3 types that we use:
- Bars
- Candlesticks
- Line charts.
They each serve a specific purpose and the idea is not to use one kind exclusively but to use them all for what they each bring to the table. You can’t have a football team made up of all fat offensive linemen. You need the skinny fast guys to run and catch the ball while the big guys block for them. Each position helps the team win at the end. It’s the same with different types of charts.
Don’t get married to one. Use them together.
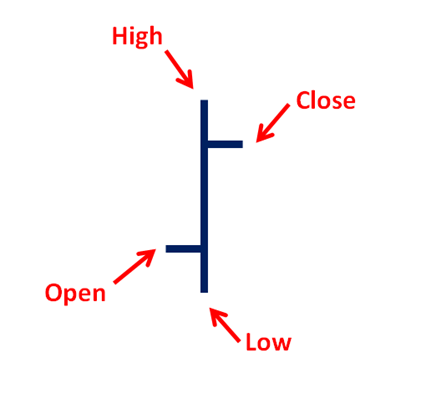
📊 Bar Charts
Bar charts are the most common type of chart used in Technical Analysis.
Each period is represented by a vertical bar, which as it turns out, is why we call them “Bar Charts” and not because technicians drink too much. If we are looking at weekly charts, each bar represents one week’s price change. The daily chart represents a single day’s price movements.
Bars can be used for even longer timeframes like months or even quarters and can be used intraday to represent 30-minute timeframes, 10-minute timeframes, and even 1-minute bars
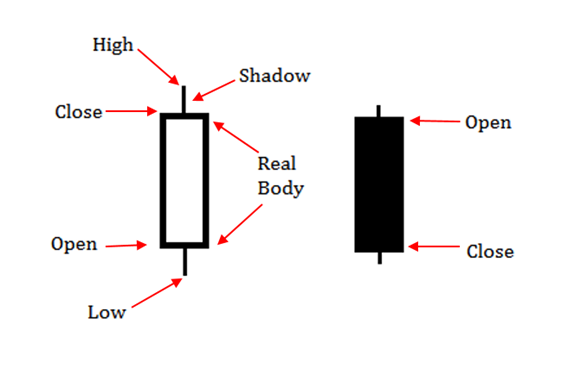
🕯️ Candlestick Charts
These are Japanese candlesticks. They are some of the most beautiful creations seen in nature. Once you understand how to read them, you’ll find them showing up in classic ways at the most important turning points in American history.
Here’s a quick guide.
📈 Line Charts
You’ll notice sometimes you will see gaps between adjacent candlesticks.
This is due to the fact that price either opened well enough below the previous low that the gap appears obvious or because prices opened above the prior period’s highs. These gaps appear more often in ETFs and volatile stocks than they do in Futures or Indexes. When you see gaps in either Futures or Indexes, it’s a much bigger deal, especially if they come on weekly charts.
Line charts connect only the closing prices for each period so it eliminates this additional noise when you need it to.
🖱️ Selecting Chart Types
In the Supercharts terminal, you can easily navigate between all the chart types, as shown below.
You can also select the various timeframes.
Click on image to enlarge view.
ANNOTATIONS
✏️ Accessing Drawing Tools
Drawing tools are one of the most important tools for technical analysts and traders.
These can include:
- Trend lines
- Support/resistance zones
- Fibonacci retracements and extensions
- AVWAPs
- Channel lines
TradingView makes this rather easy to access.
All the drawing tools can be accessed on the left hand side.
Click on image to enlarge view.
💾 Saving Drawing Tools
TradingView has an incredible number of drawing tools.
I like to keep things simple with just a few.
You can easily save the annotation tools you use on a daily basis to prevent you from having to manually find them among all these tools.
You can do this by finding a tool you use on a regular basis and pressing the star next to it to make it a favorite. Using the fibonacci retracement tool as an example, I set it as a favourite.
Click on image to enlarge view.
From there, you can press the star in the bottom left hand side of your screen to get a toolbar of your favorite tools.
I have shown this below.
Click on image to enlarge view.
MY SETTINGS
🙋 Which Tools Do I Use?
I have favorited seven tools that I use on a daily basis.
- Rectangle for support and resistance zones
- Trend line
- Text to annotate the chart
- Channel lines
- AVWAP
- Horizontal ray to identify key price levels
- Fibonacci retracement/extension tool
⬇️ Download My Settings
The only tools that need customizing (besides from an aesthetic/design perspective) are the fibonacci and AVWAP tools.
Here are my fibonacci settings.
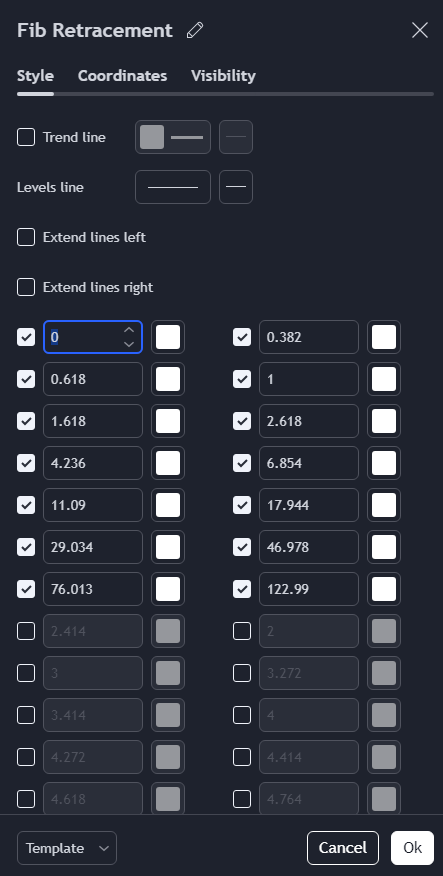
Click on image to enlarge view.
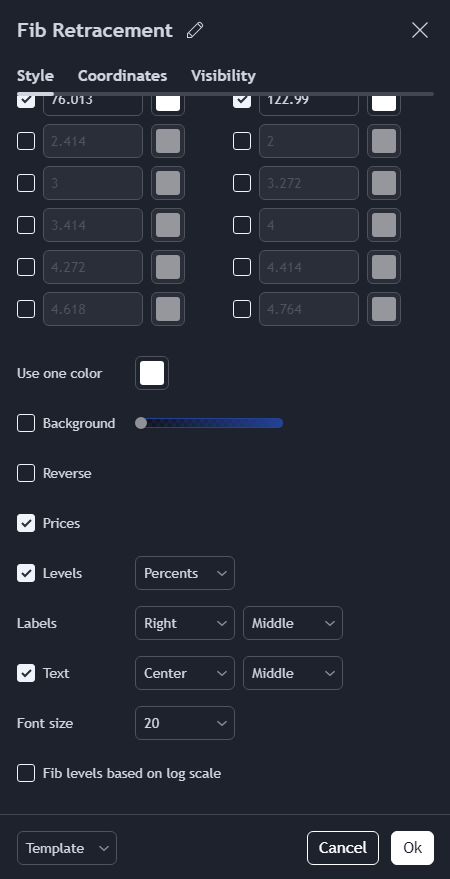
Click on image to enlarge view.
It is important that you do not adjust the Fib levels based on the log scale, as this messes up the calculations.
As for my AVWAP settings, here they are.
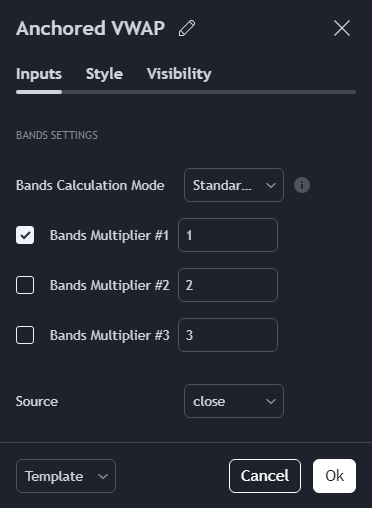
Click on image to enlarge view.
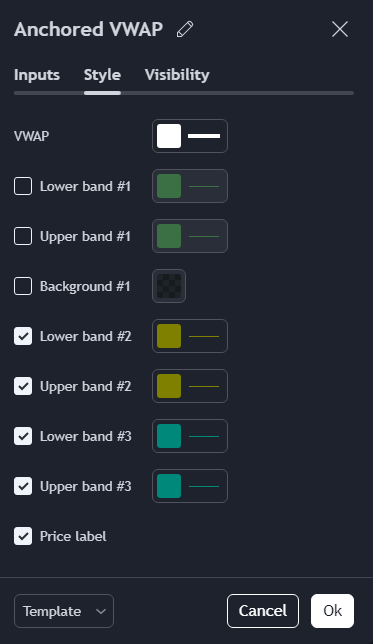
Click on image to enlarge view.
🗑️ Deleting and Changing Drawings
Our charts can get messy quick.
So to quickly delete all the tools, you can click the rubbish icon in the bottom left to remove all the drawings.
Click on image to enlarge view.
That marks the end of Module 2!
🎯 Key Takeaways from Module 2:
- You now understand the key chart types
- You know how to access different types of charts on TradingView
- You've learned the most important drawing tools
- You have my drawing templates ready to use
💡 Quick Tip: Keep the drawings simple. Annotations are there to assist you in your understand of price action, not your own opinions.
🔔 Up Next: I'll give you a few days to absorb this information and from there we'll move to Module 3 where we'll explore technical analysis tools and indicators.