I came down with a pretty bad cold this weekend. Most of my Sunday was spent quarantined in my office so I wouldn't get my kids sick (4yr old and twin 2yr olds).
Of course, rather than laying in bed resting, I was in my office looking through charts.
I couldn't help myself.
It's my way of relaxing. And as it turns out, I do feel a lot better today than I did when I woke up yesterday.
But one thing I was able to do was go one by one counting stocks, sectors and indexes all over the world to see if these ugly rumors about weakening market breadth were true.
As it turns out, they're just lies.
Market breadth continues to expand as more and more countries around the world are hitting new highs, not fewer.
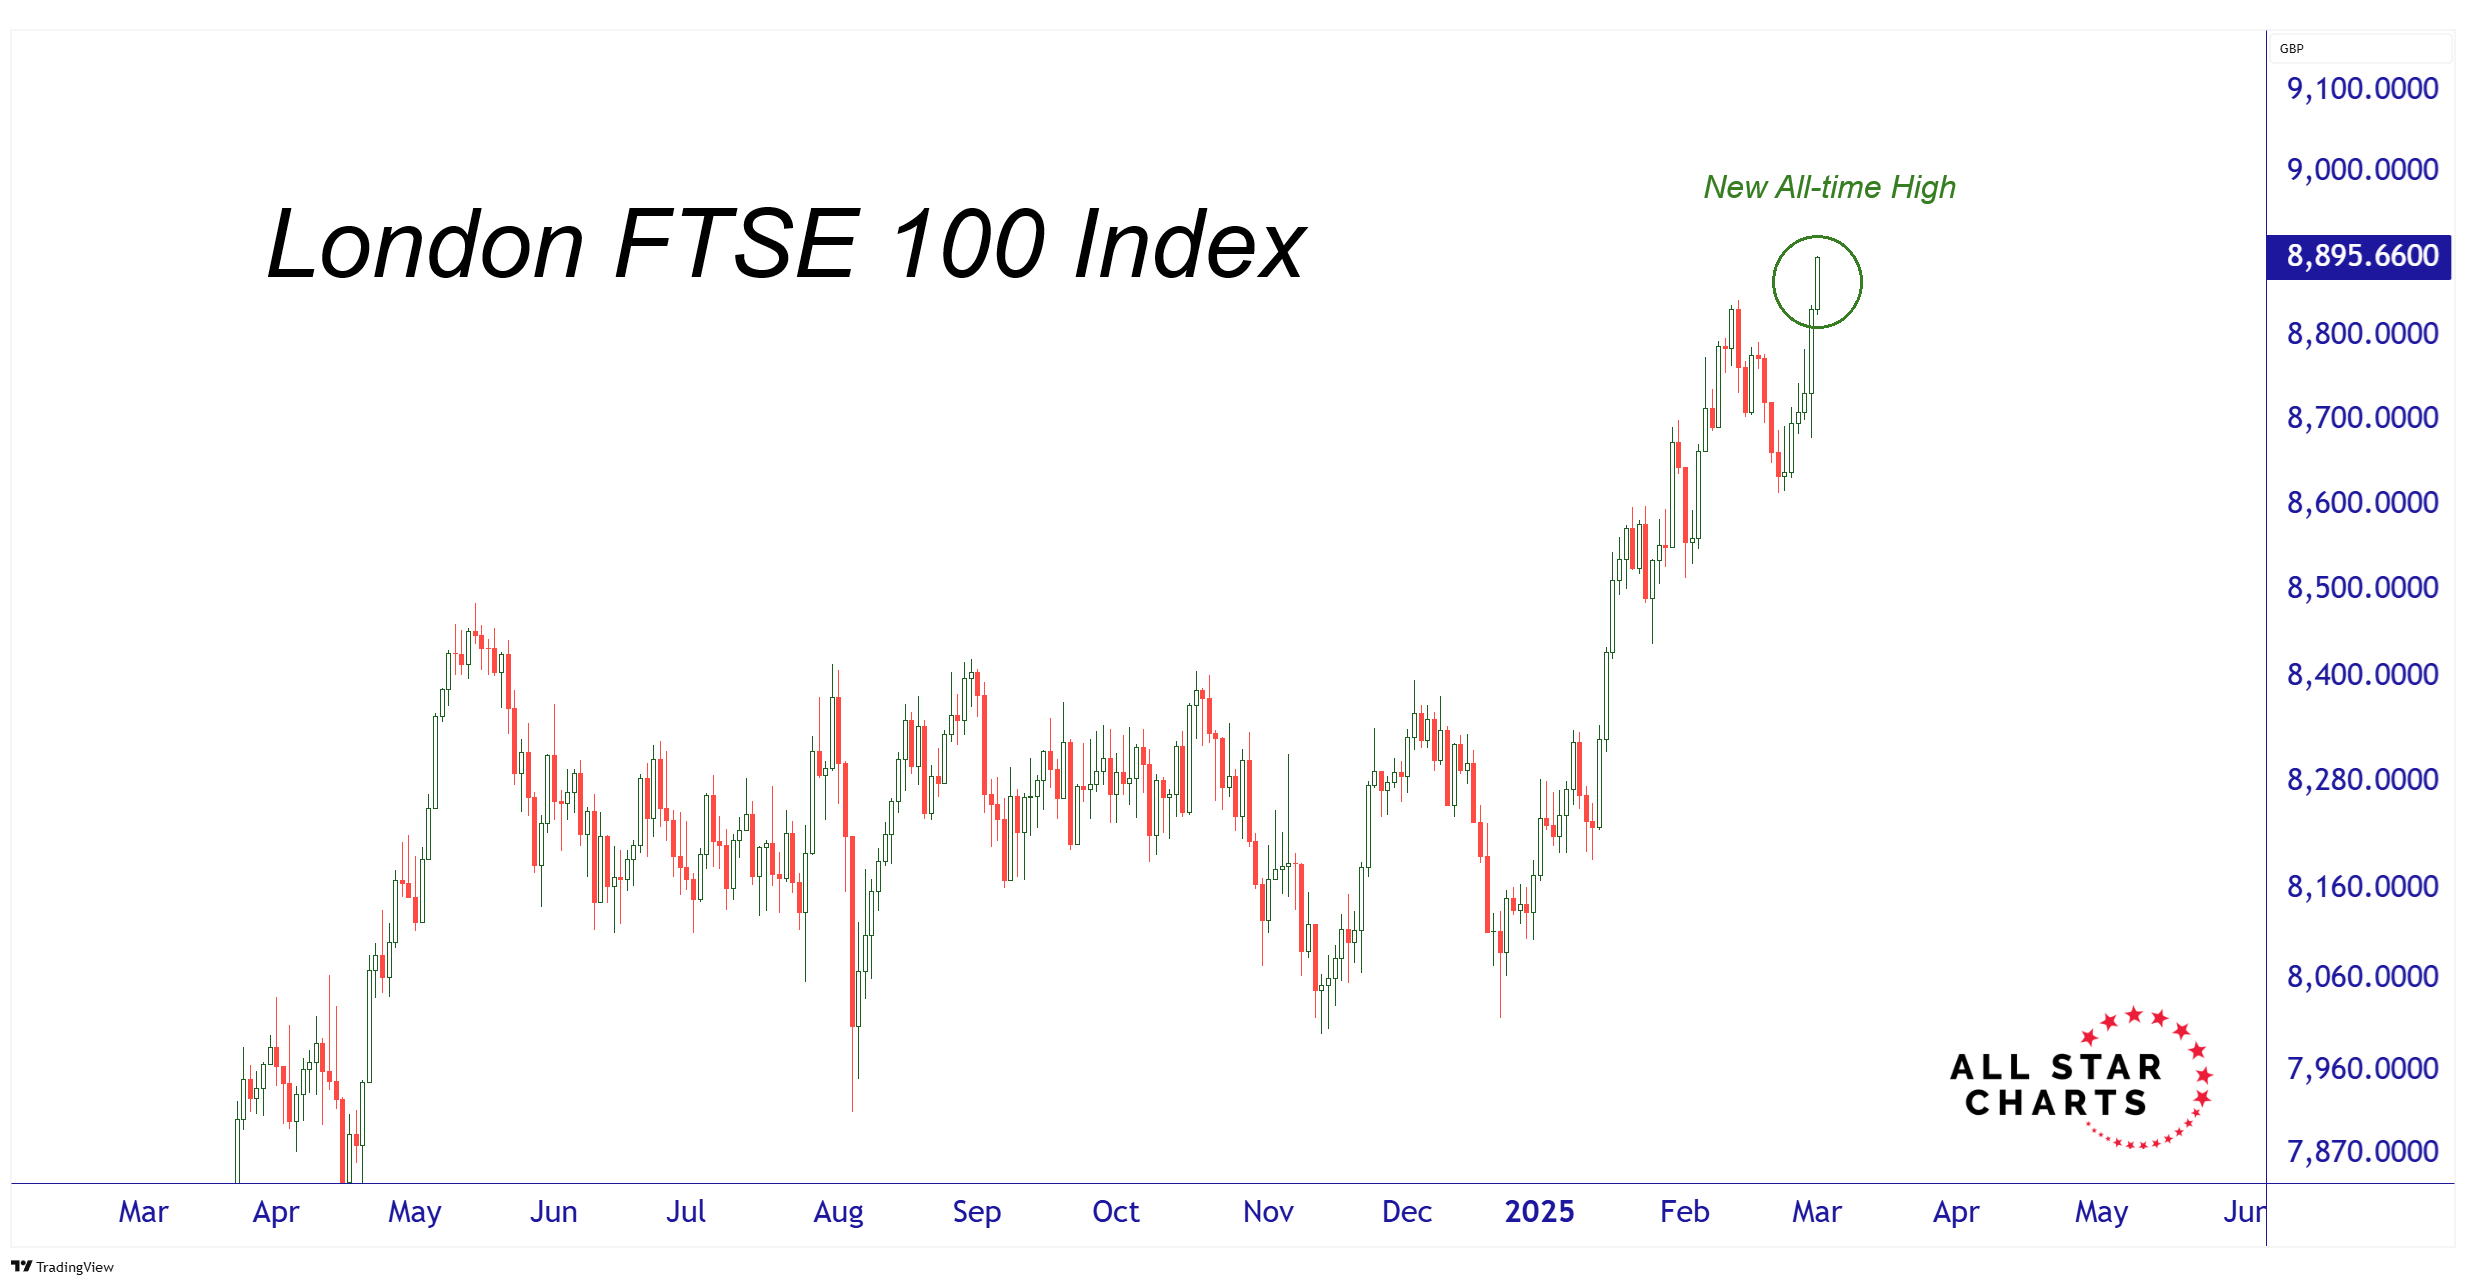
But if you go one by one, you can really see all the strength underneath the surface. Here's the London FTSE100 Index hitting new all-time highs again this morning:
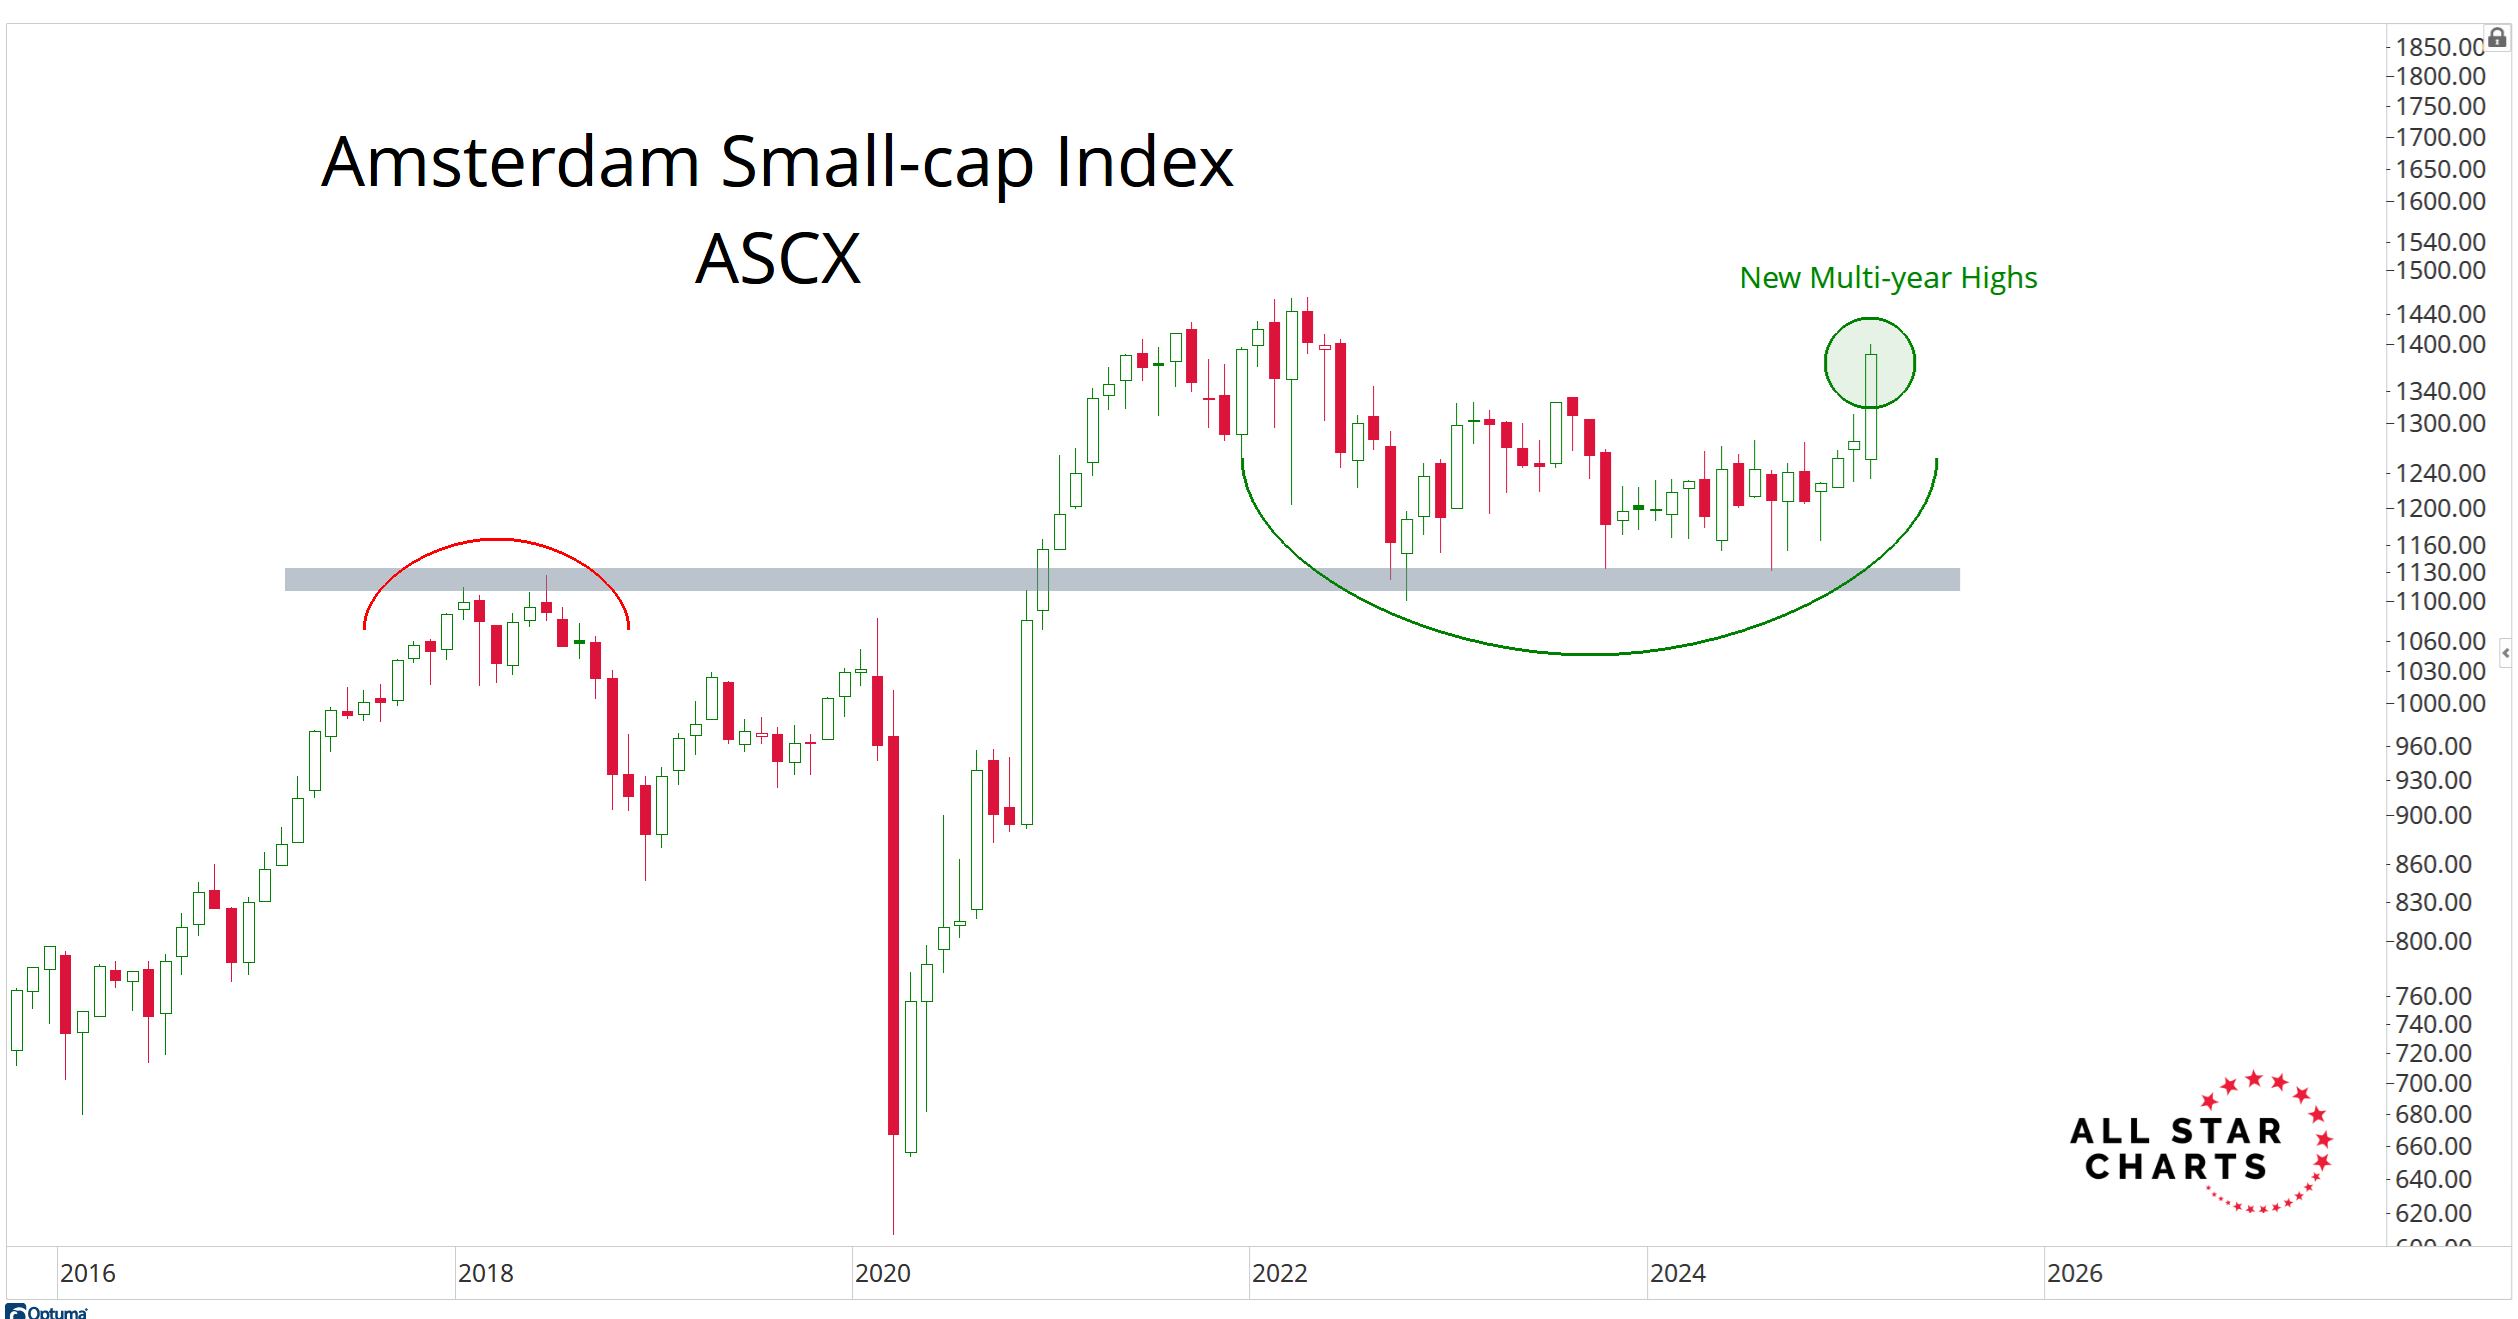
And even as you go down the cap-scale, it's not just the large-caps that are doing well.
But when you go country by country, you'll notice the same thing.
Take a look at Dutch Small-caps breaking out to new highs:
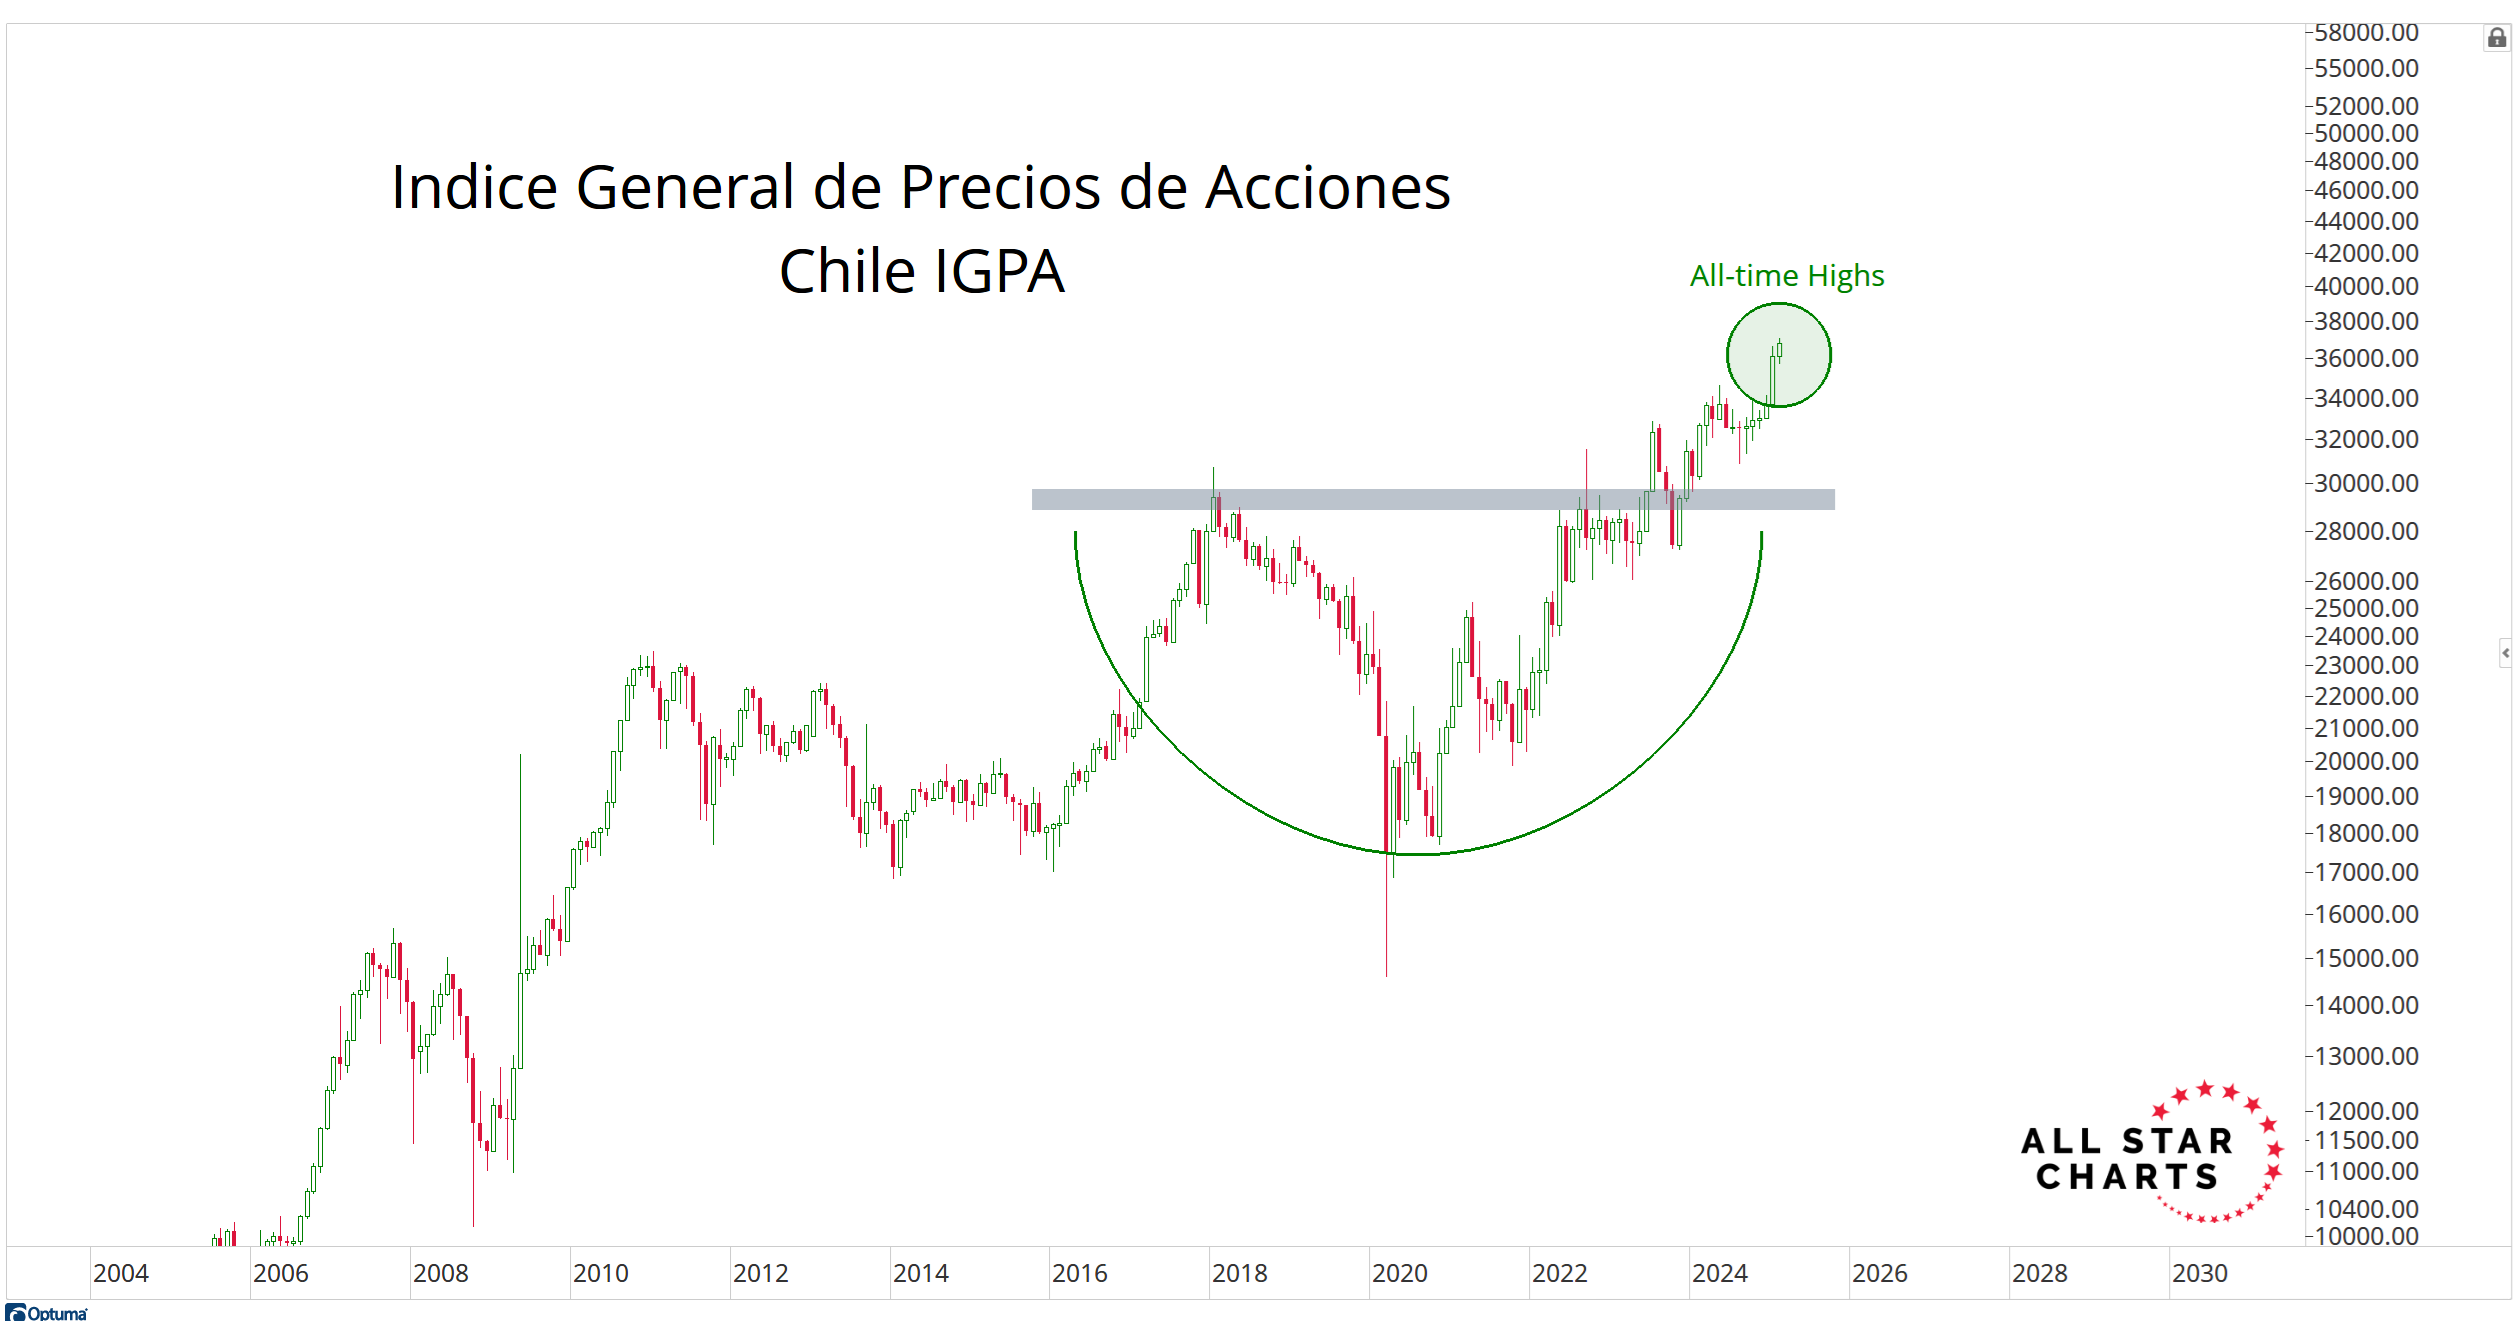
Even outside of Europe, the strength continues.
Look at Chile closing at new all-time highs again this month:
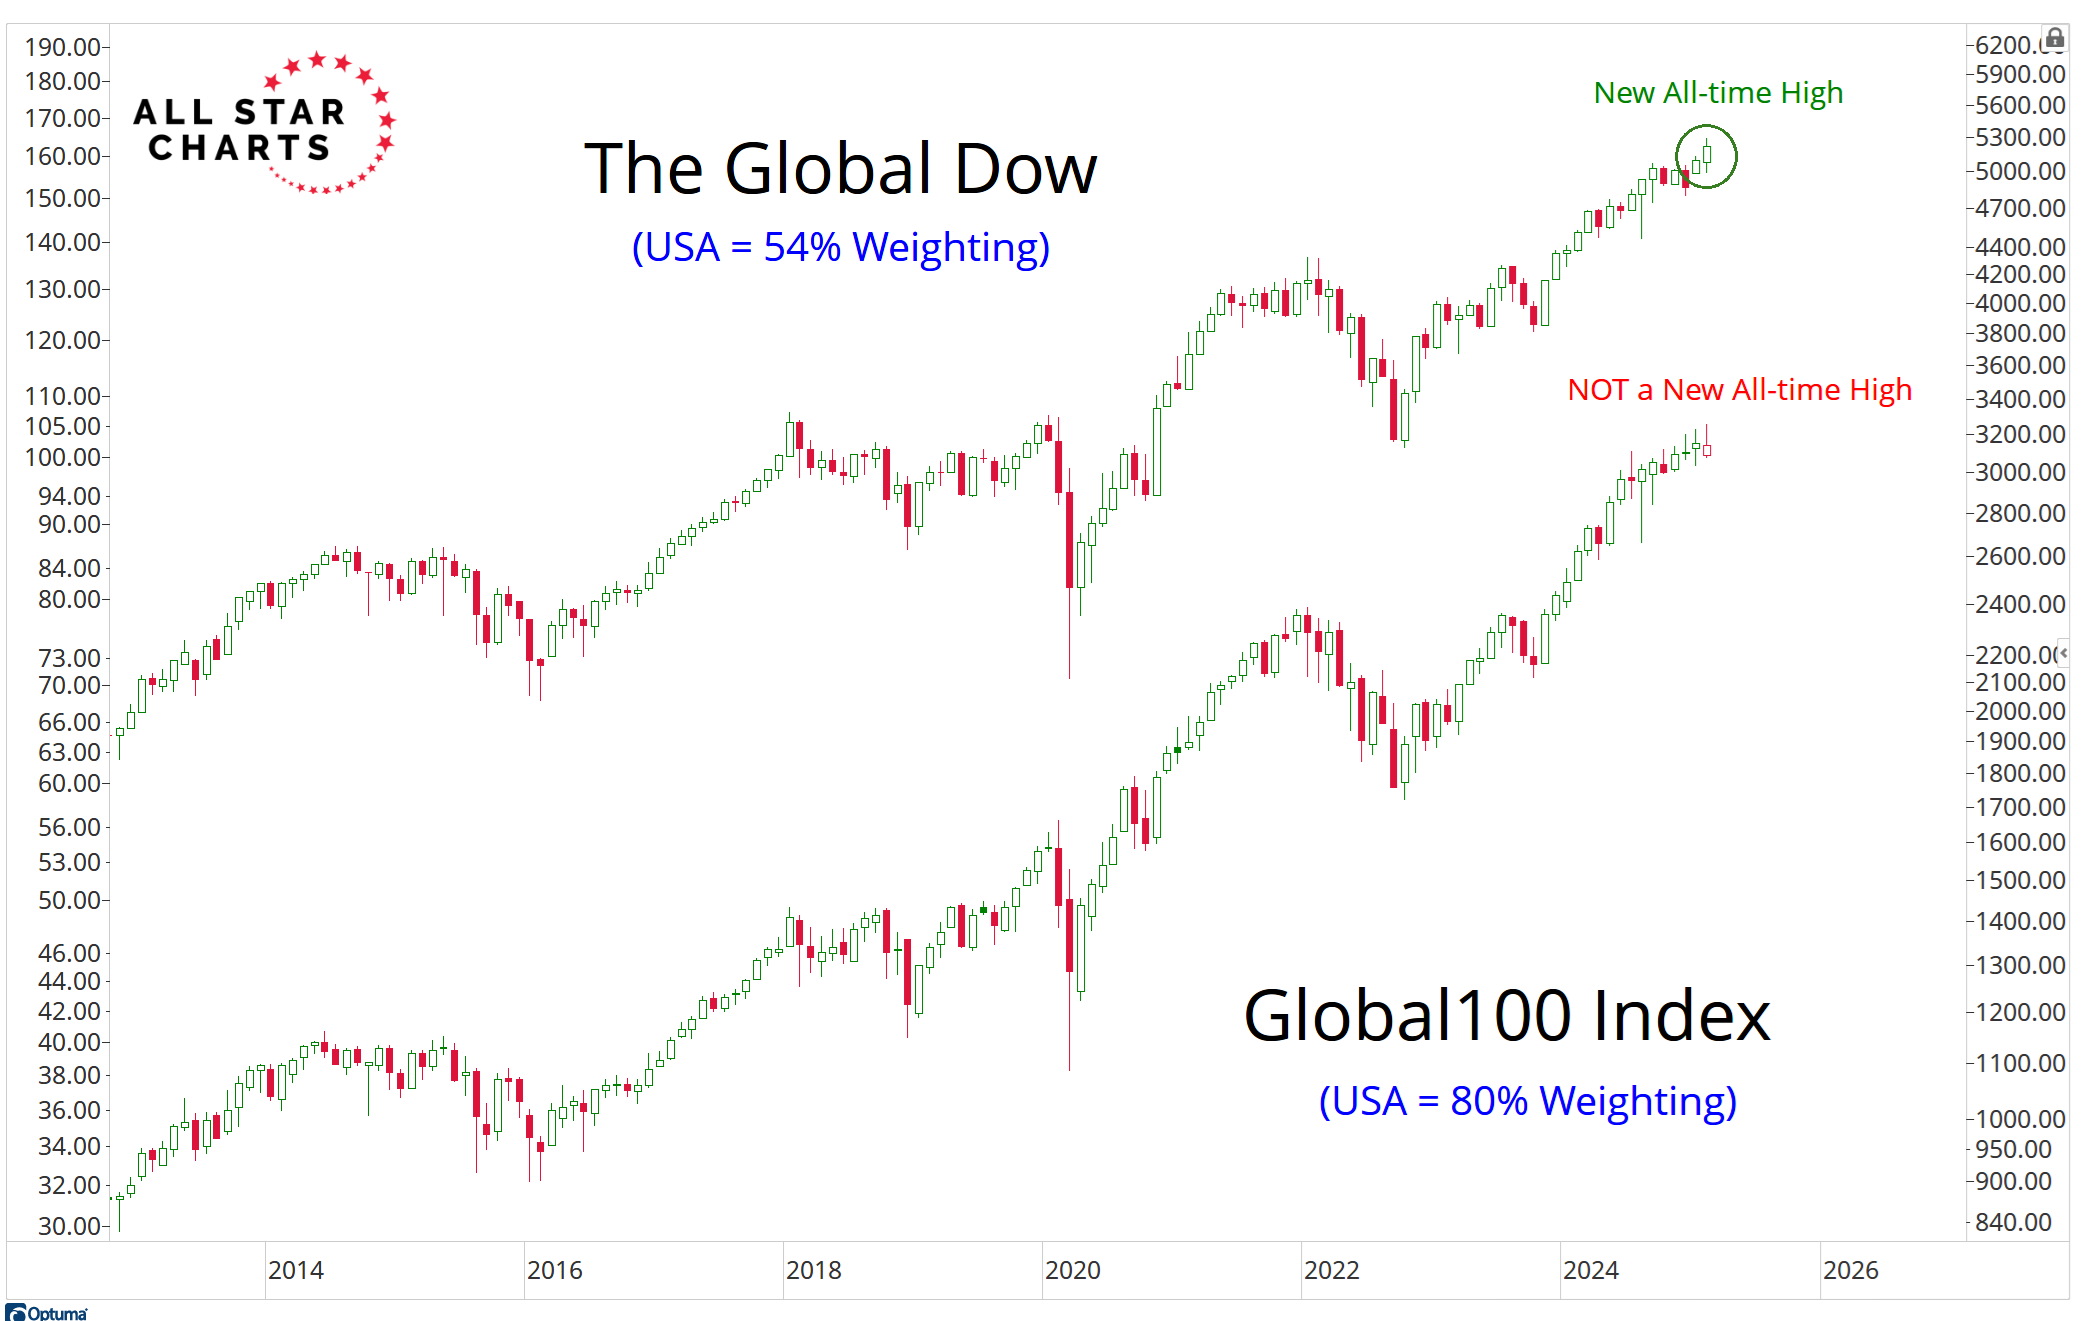
One thing that I find interesting is that the Global Indexes with less exposure to U.S. stocks are doing better than the Indexes where the U.S. has a higher weighing.
Look at the Global Dow (with only a 54% weighting to the U.S.) hitting new all-time highs, while the Global100 Index (80% weighting to U.S. stocks) is underperforming.
It's been a while since we've seen this sort of thing:
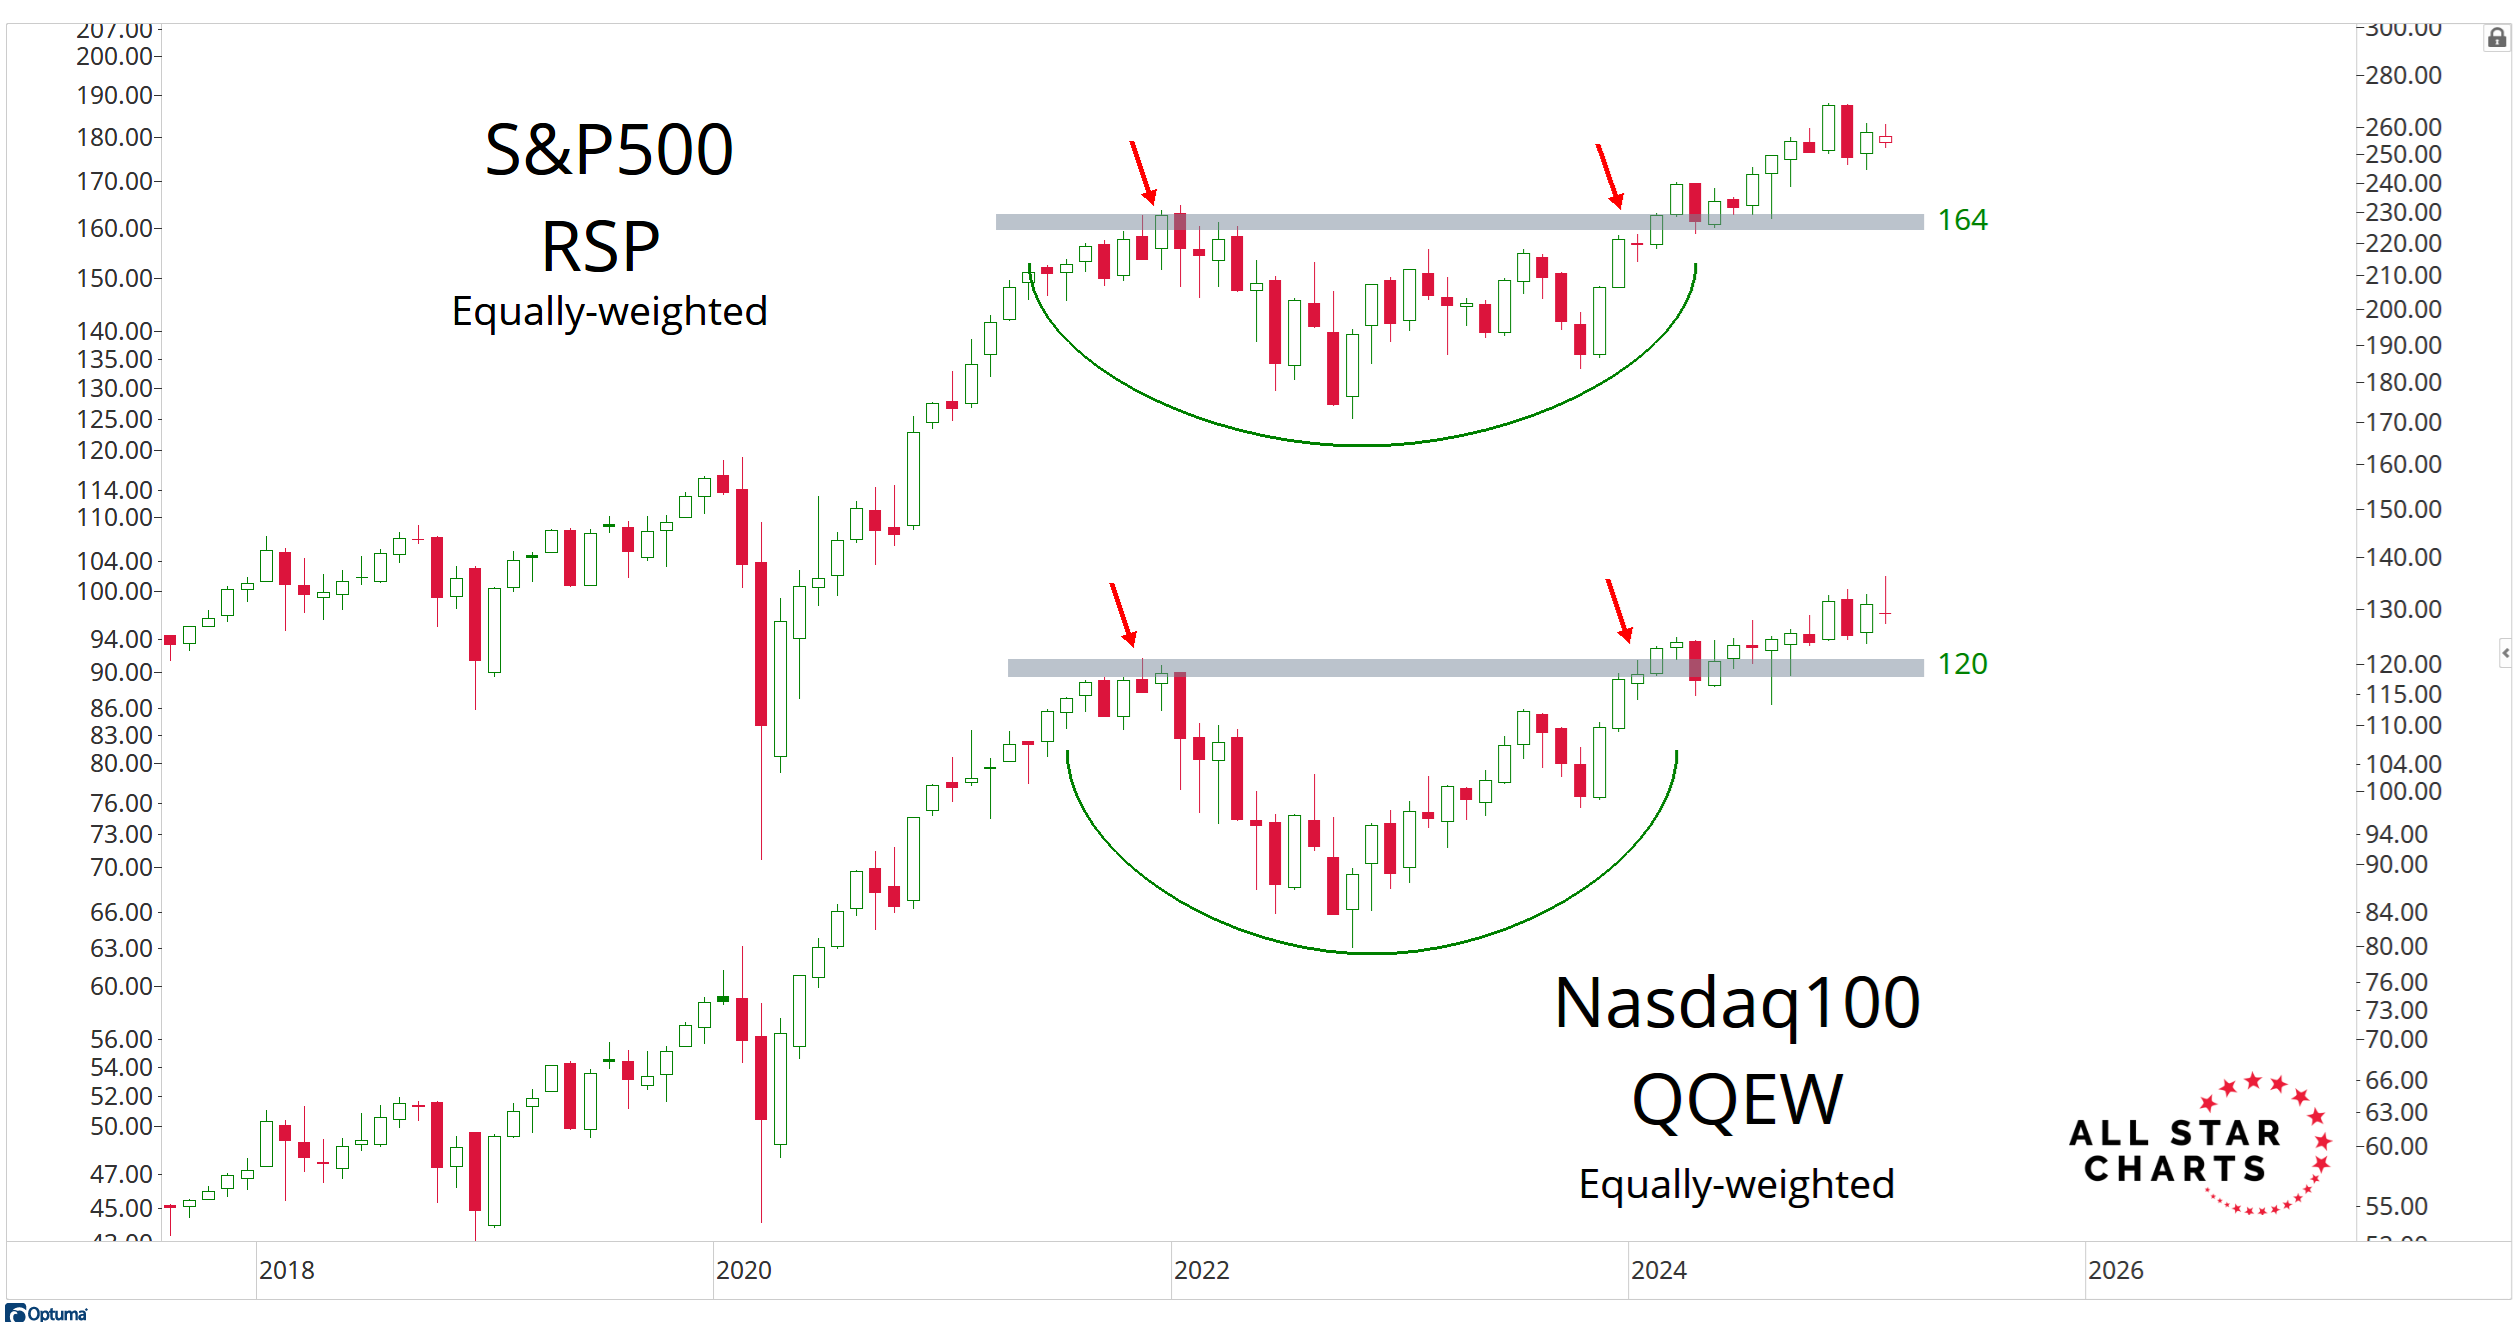
Now when you look at the U.S. in isolation, I will ask you this.
Do these look like downtrends to you? Or do they look more like new uptrends?
Both the S&P500 and Nasdaq100 are above their prior cycle highs, on an equally-weighted basis. As long as that remains the case, it's hard for me to be too bearish.
Meanwhile, when you go sector by sector in the U.S., do you know how many of them closed February below their 10-month moving average?
One. Materials. The smallest and least relevant sector in America.
For those of you who might be new to the 10-month moving average, this is something we look at once each month as we do our Monthly Candlestick work.
The 10-month moving average system is the oldest trend following system that I know of. It's been around since way before I was born.
Simply put: Bad things happen below the 10-month moving average.
Keep in mind that 10 months = 40 weeks = 200 days.
So if you're like me, and you're only in the market to try to make a profit, then you're going to want to join me tonight for our LIVE Monthly Charts Strategy Session.
We do this at the beginning of every month, and it's where we discuss all of the most important market trends, and dive in very specifically into how we're going to profit from those trends.
This is where all our best ideas come from, but it's exclusive to Premium Members of Allstarcharts Research.
Also, keep in mind that if you cannot be there live, the recording and charts to download will be made available immediately after the completion of our Video Conference Call, along with every other Conference call since 2015.
If you take your portfolio seriously, tonight is a can't miss event.