As we head into September, we want to keep in mind that this is historically one of the most difficult months of the year for stock market investors.
But what could cause markets to struggle for a while, after such an impressive year for returns?
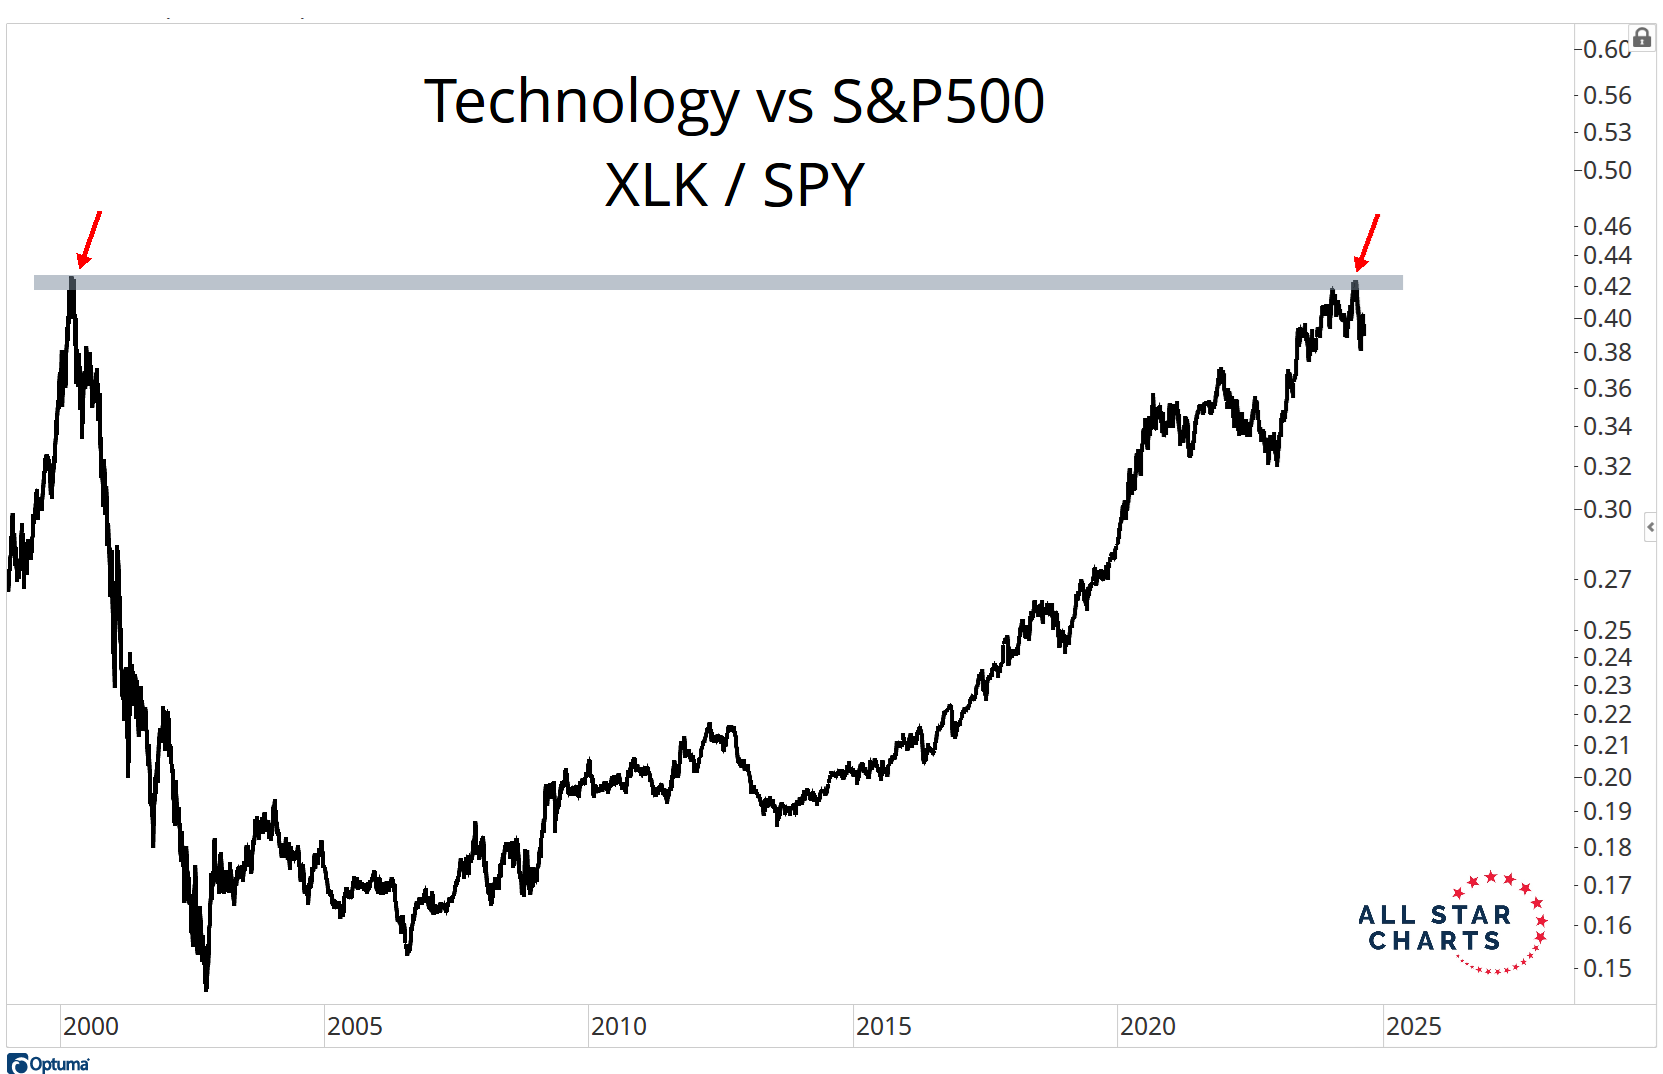
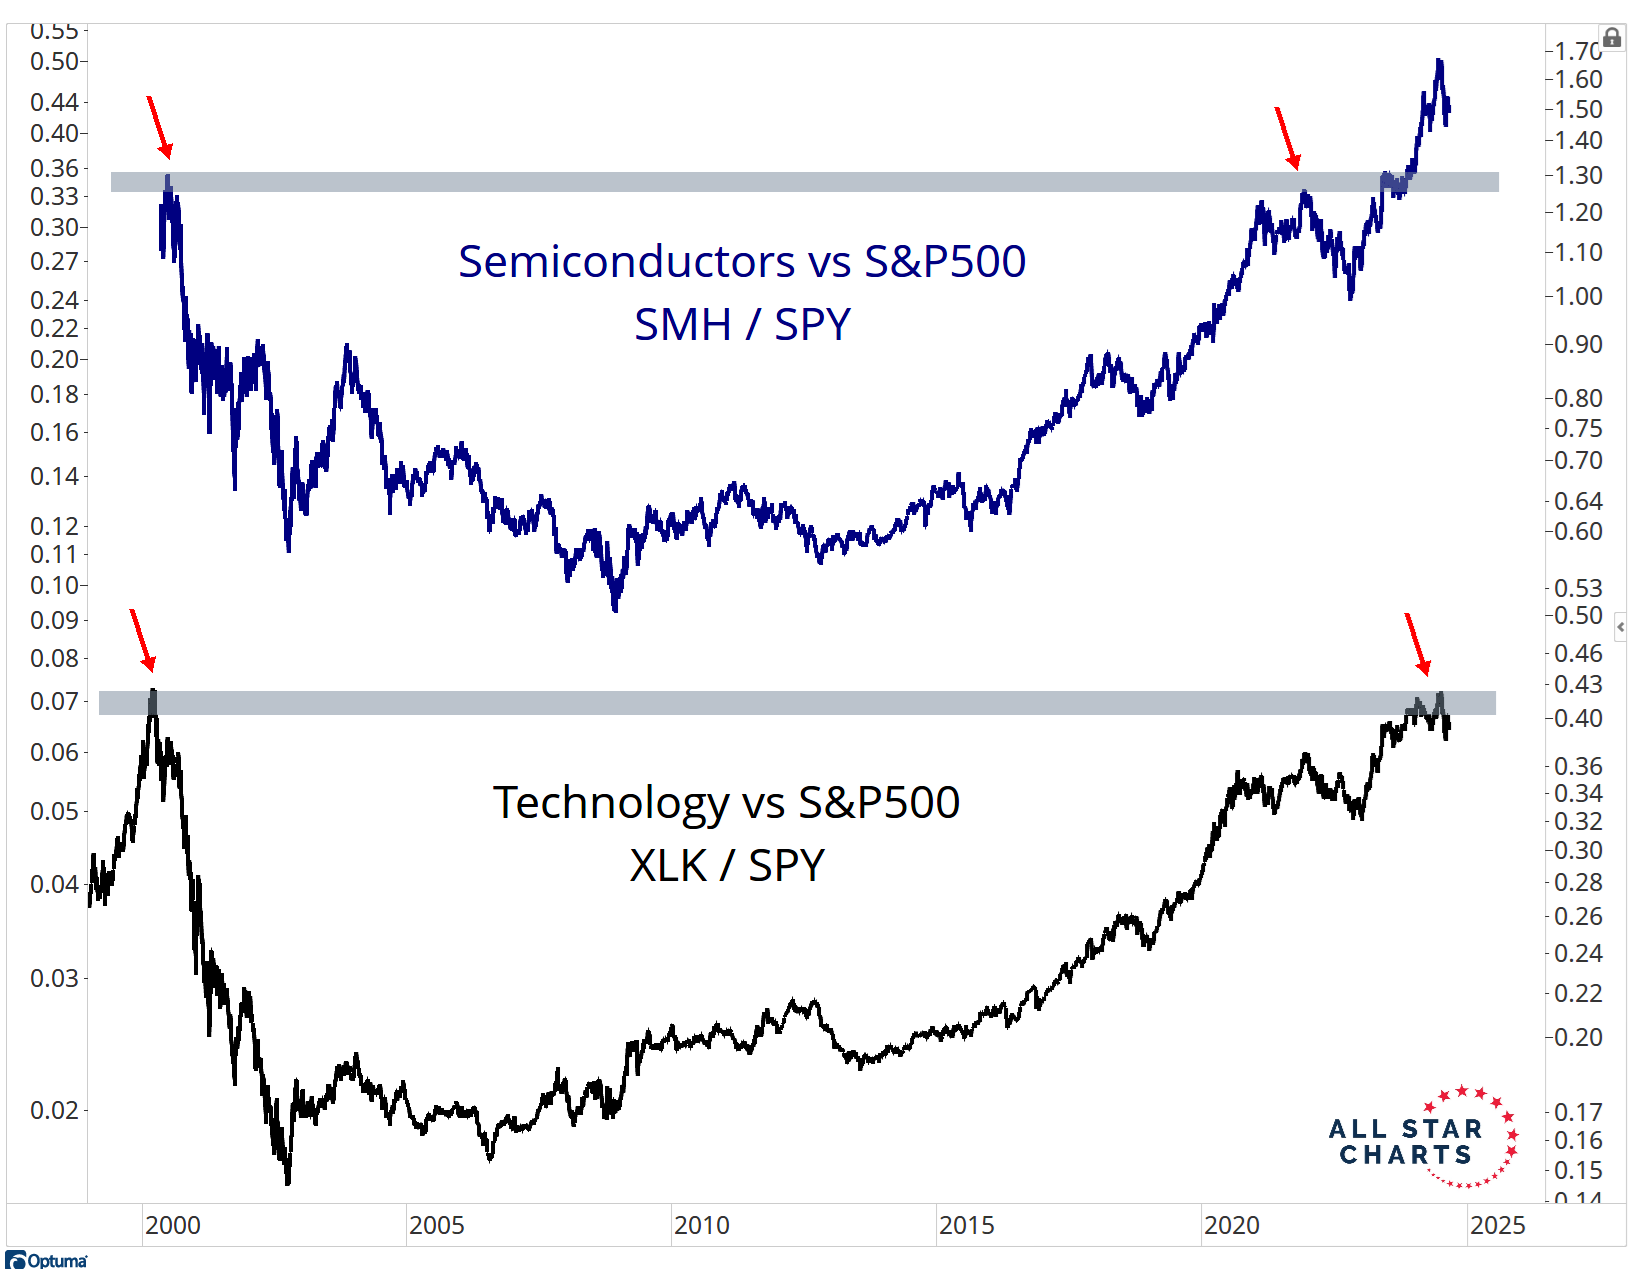
This is the chart that stands out the most to me. We're looking at Technology relative to the S&P500 getting back to its former dot com bubble highs. This is Tech, which represents over 30% of the S&P500.
After 24 years, prices are finally back to the highest levels reached in March 2000, before the historic crash began:
The way I see it is that the market has already proven that it's respecting these levels.
Since achieving this feat, Technology has underperformed to the point where Large-cap Tech is pushing down against new 52-week lows relative to the S&P500.
So it's no longer an, "I wonder if the market is going to acknowledge those highs from 24 years ago" situation, and more of an, "I wonder how long these levels will serve as resistance" question...
So yes, resistance from 24 years ago still matters, contrary to popular belief.
Please feel free to weigh in on a similar debate about Japanese Nikkei and its highs from 1989 coming into play this summer. Tweet at the group here and tell us how you feel.
But back to U.S. Tech, I do think eventually Tech does break out to new all-time highs relative to the S&P500.
Remember, when you go back and study every bull market over the past 100 years, Technology is a leader and outperformer in almost every single one of them.
The questions is, How Long?
Take a look at Semiconductors relative to the S&P500 going back to those same March 2000 highs.
Notice how Semi's have already completed this massive multi-decade base, and exceeded those prior levels.
This is part of what leads me to believe that the overall Tech sector will follow along at some point.
In the meantime, I think there are going to be opportunities to make money from the long side, and probably the short side as well.
You see, correlations are the lowest among S&P500 components than at any point during this entire bull market.
When volatility spikes, correlations go to 1. As the bull market ages, these correlations historically come off.
And that's exactly what we've seen.
That leads me to believe that there should be huge winners AND losers over the next 6-8 weeks.
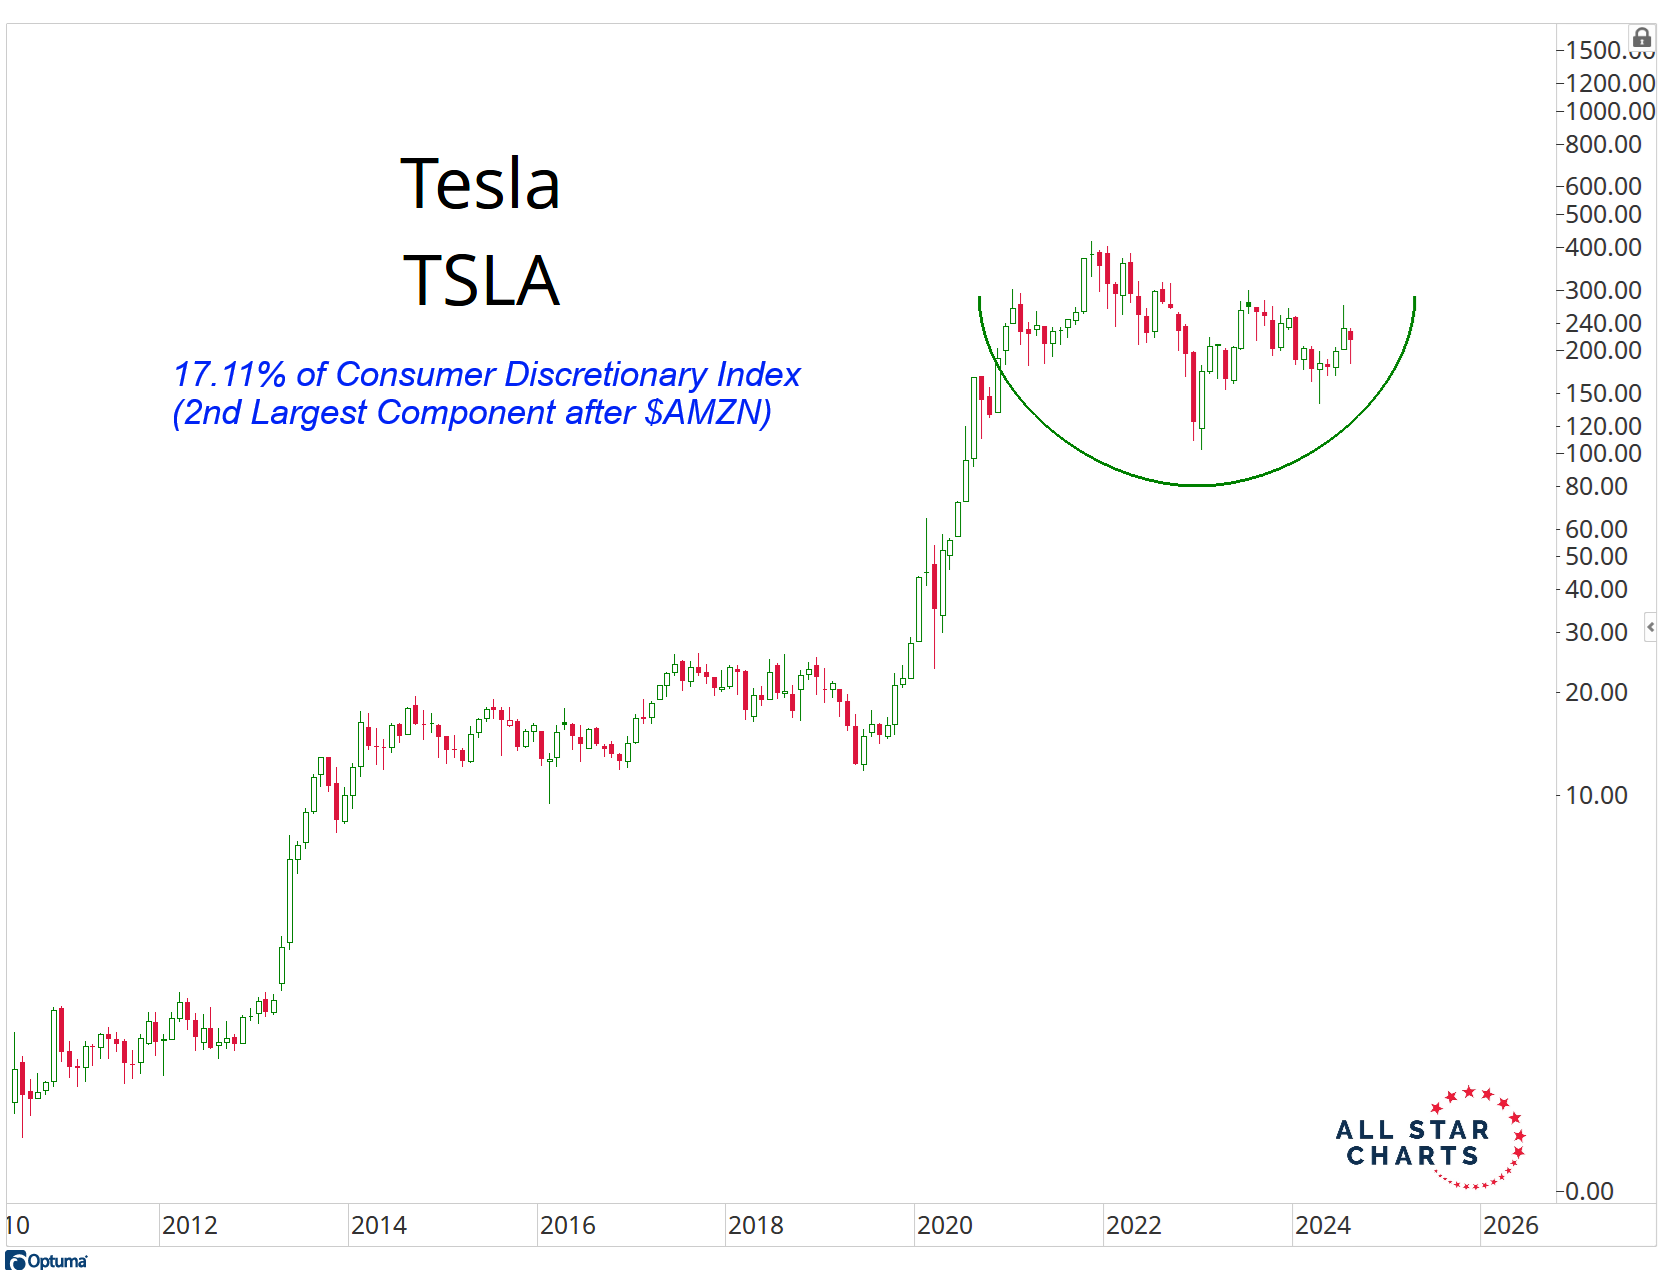
Tesla is a great example of a "Tech" stock that's not even in the Technology Sector.
In fact, Tesla carries a 0.0% weighting in the S&P Technology Index. It is actually the 2nd largest component (behind AMZN) in the S&P Consumer Discretionary Index.
After a 3000% return in 2 years, Tesla has now been consolidating sideways for almost 4 years.
Talk about a well-deserved digestion of gains.
Never had a company created more shareholder value faster than Tesla.
But with that historic performance comes a period of digestion.
There will be winners and losers in Tech, especially in the "Tech" stocks that aren't even considered Technology by the Standard & Poors Index providers.
We have a lot to talk about.
I'll see you tonight!
Now go see what else is happening around All Star Charts...
Counting All-Time Highs. The list of stocks going up keeps getting longer and longer. That's probably NOT because breadth is deteriorating. In fact, the Advance-Decline line on the world's most important stock exchange just hit new all-time highs. So did the world's most important stock index.
A Hedge for Our Coffee Addiction. We've had tremendous success trading cocoa futures in the last several years. We're also close to buying cotton futures as they look to trap the bears below a key polarity zone. There's a trend here: soft commodities keep rewarding us for owning them. We think coffee is next.
For me, it's less about Nvidia itself, and much more about finding the NEXT Nvidia.
That's where our 2-to-100 Club comes in.
This system is specifically designed to find the next $100 Billion company. In other words, we're looking for Nvidia before it becomes "Nvidia".
The companies that show up on The 2-to-100 Club scan are involved in the most exciting sectors and industries, like biotech, medical devices, and software.