Another BRIC In The Wall For International Equities
It was this week’s Mystery Chart, the iShares BRICs ETF $BKF which is simply a market-cap weighted index of Brazil, Russia, India, and China.
Here's a look at the weekly chart dating back a little over a decade:

Many of you wanted to buy the retest, citing our penchant for big base breakouts and the supportive momentum reading.
We couldn’t agree more… But this chart doesn’t show the full story.
The BRICs taking out decades of overhead supply at those 2018 and 2011 highs is an incredibly bullish development, especially if buyers can defend this key level from above now.
Yet when we zoom out on the chart, it becomes clear that it's not just this 50ish area, but the recent peak around 60 is also a critical level.
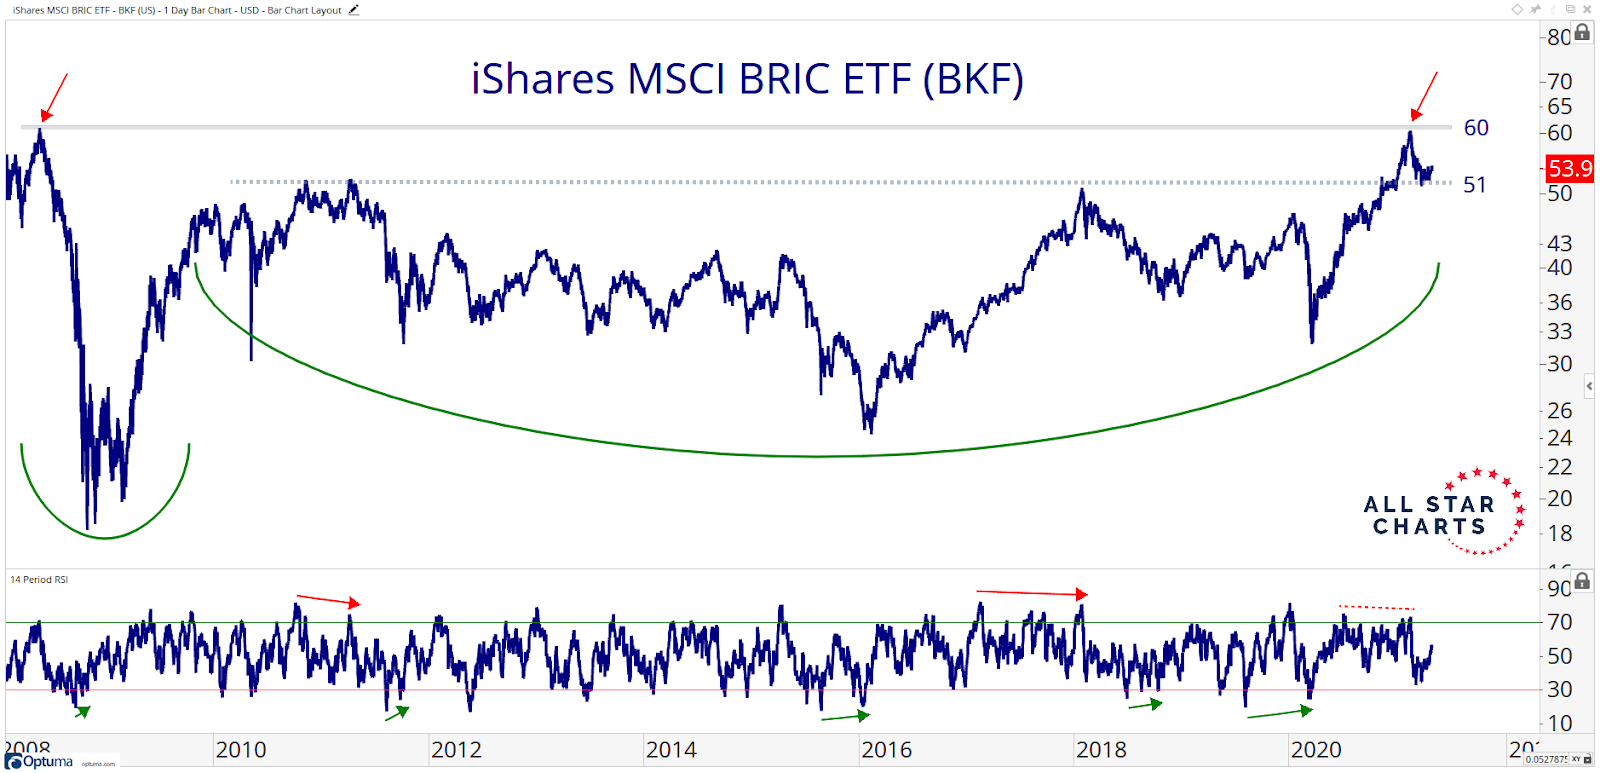
Prices stopped and reversed in February right at their pre-financial crisis highs in the low 60s. Probably not a coincidence...
So the 51 zone was definitely a key area of former resistance, but the real test is whether or not BKF can break through the overhead supply looming just above 60.
If we’re stuck between this range, we’re likely to see some more consolidation. This fits into our current view of further range-bound action for risk assets.
So, where can we look for evidence of where things go from here?
Back in October, we put out a post discussing the importance of China as the main driver, due to its heavy weighting, in many of these indexes.
We talked about all the country breakdowns, but here’s the long and short of it:
- China has over a 10% weighting in the All-Country World Index $VEU and is home to its two largest holdings, Tencent $TCEHY and Alibaba $BABA
- Chinese stocks represent about 40% of Emerging Markets $EEM
- As for the BRICs Index, China makes up a whopping 70%
The bottom line is this: the performance from China is likely to dictate the direction which many of these world indexes resolve from these significant levels of interest.
The recent weakness in Chinese markets has weighed on EM as the Emerging Markets Ex-China index $EMCX just made new highs this week while EEM (which includes China) is still more than 7% away from its February high.
When we overlay these two ETFs it illustrates how China tends to give a nice leading signal for the EM index:
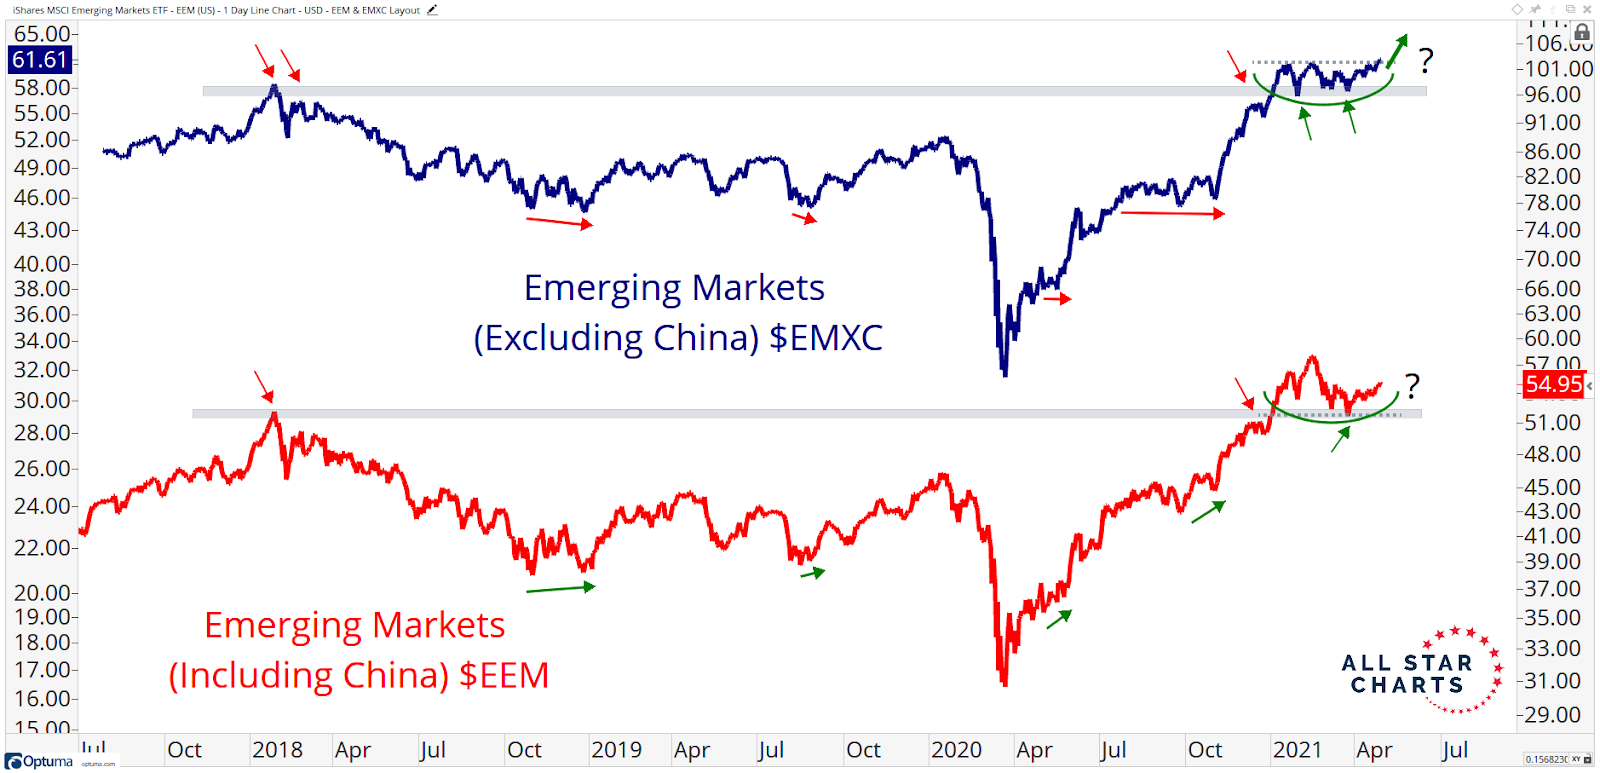
So, is this recent weakness in China telling us to look out? If some of these key international indexes violate these major support zones, we’d likely be looking at some nasty failed breakouts and have a much more cautious outlook on equity markets.
On the other hand, we could also see China get things in gear here. In fact, the iShares China Large-Cap ETF $FXI has been trying to carve out a tradeable low here at yet another key level of interest.

The 45-46 area is the line in the sand for China. If we’re above there, risk is well-defined and we like it long back toward those February highs just above 54 over the next few months. Below there, and we want nothing to do with it.
At the very same time, when we zoom out and look at Chinese stocks relative to US stocks over the very long-term, price couldn’t be at a more logical level to find support, and start to show some relative strength.
Here's the Shanghai Composite $SSEC vs S&P 500 $SPX dating back almost 30-years:

Do I even need to say it?
Those key former lows around 0.80 are a big deal. They've acted as support at least four times since 1995. If Chinese stocks can hold up here and start working higher against the S&P, odds are we're in an environment where the key levels discussed throughout this post are at least holding, and likely even trending higher back toward our targets.
For now, we’ll just have to wait and see.
As for the BRICs, due to the risk-on/ global growth nature of these countries, we think there is very valuable information in the index and it could even be an early signal for world equities (due to its heavy China exposure) -- so we’re monitoring it closely.
This is the playbook:
If we’re stuck in this 50ish to 60ish range, you can trade it, but expect more chop and trendlessness until one of these levels breaks.
Below 50 and lookout. We're likely in a more cautionary environment, and will be watching our international checklist to see if similar support zones are being violated in other major indexes.
But if and when we're above those former record highs in the low 60s, it's go-time, the bulls are back in control, and we’ll probably be buying international equities hand over fist.
As always, drop us a note and let us know what you think!
[hide_from accesslevel= “premium”]If you enjoyed this post and want access to our premium research, start your 30-day risk-free trial or sign up for our “Free Chart of the Week” to receive more free research like this. [/hide_from]
Allstarcharts Team