Santa Claus Rally Begins Thursday

It was Yale Hirsch who discovered and named the now popular "Santa Claus Rally" back in 1972. The way he explained it was,
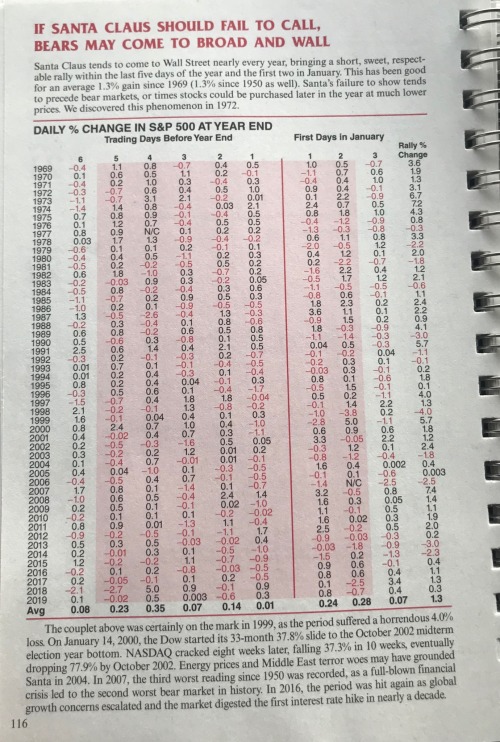
If Santa Claus should fail to call, bears may come to Broad and Wall.”
His point was, and for us still us, that if Santa doesn't show, that historically precedes a period of weakness for stocks. (If you've never been, the New York Stock Exchange is located on the corner of Wall St. and Broad St.)
To be clear, the Santa Claus Rally is not a December thing. The "SCR" period represents the last 5 trading days of the year and the first 2 of the following year. This 7 day period has returned an average of 1.3% for the S&P500 since 1969, and an amazing 1.7% average gain since 1928. And while that's fine and dandy, when this regularly scheduled rally does NOT occur, that's when we want to pay attention. Because this no-show normally precedes a flat or down year for stocks.
According to the Stock Traders Almanac, Santa failed to show 6 times since 1994. In other words, on only 6 occasions did the market not rally during this 7-day period. Of those, we saw 3 flat years ('94, '04 & '15), 2 very nasty bear markets ('00 & '08) and a mild bear that didn't end until February of 2016. Needless to say, they weren't good times for shareholders.
You can see the whole list here directly from the Almanac:
This year, the clock starts on Thursday December 24th and doesn't end until Tuesday January 5th. Because of the way the weekends and holidays line up, this year's SCR Period is going to last longer than others.
Historically, stocks during this 7-day period do MUCH better than all the other 7-day periods throughout the year. According to Oppenheimer, since 1928, the S&P500 is up 78% of the time, averaging a 1.7% return. This is compared to all other 7-day periods up only 57% of the time, and averaging a return of just 0.2%.
The focus here, however, is If Santa Fails to Call. According to that same Oppenheimer study, 6 months into the new year the S&P500 is up on average of 5.3% when Santa shows up (if stocks rally during this 7 day period). However, when Santa doesn't show, the S&P500 is down an average of -0.3%.
I hope this little 411 about the Santa Claus Rally sheds some light on what exactly it means and why we should care.
Forget all the stuff you hear about it.
This is what's important.
Shoutout to Yale & Jeff Hirsch for being so consistent with providing this data for so many years.
We're standing on the shoulders of giants, and Yale is certainly one of those!
JC

