I'm in Miami this week, where I grew up, visiting family and I'm feeling nostalgic.
So I wanted to share a chart that I've kept with me for a long long time. I even used the same Stockcharts.com chart, that I originally annotated a handful of cycles ago, so you can see just how long I've had this one with me.
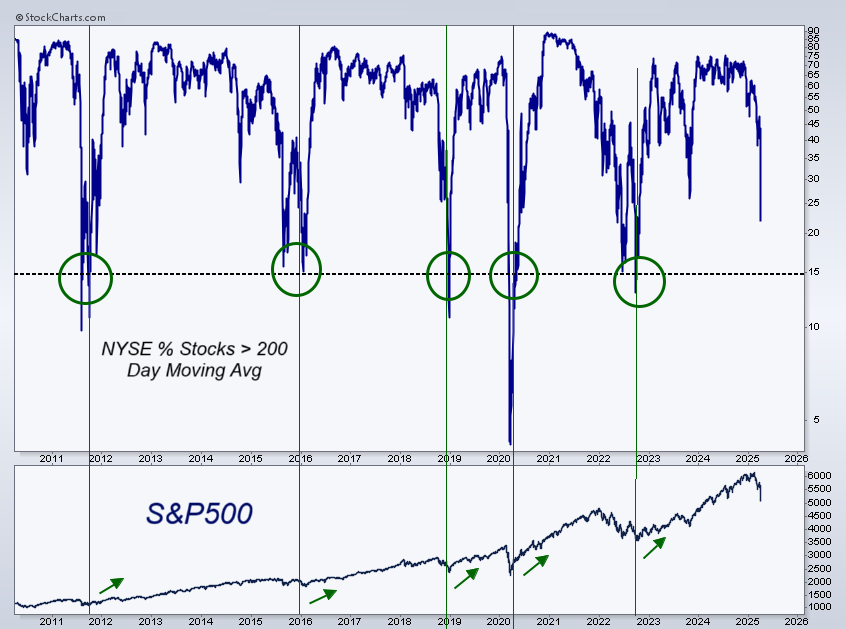
We're looking at the percentage of stocks on the NYSE that are above their 200 day moving average.
The idea here is that we are NOT interested in buying the indexes on their way down below 20% of constituents above their 200 day.
The goal during these times is to buy them on the way back up.
I've been having this debate with some of the world's top portfolio managers and strategists for over the past 2 decades.
Some of these arguments have even gotten pretty heated throughout these cycles. I remember one private back and forth during the late 2018 period where the strategist was pounding the table about the 20% level, while I was much more focused on the 15% mark.
Here's the answer. Or at least, here's my answer:
The best setup where I like to put material wealth to work is when the percentage of stocks on the NYSE above their 200 day moving average falls below 15%, but then rises back above the 20% mark.
That's the key part here.
It's not about buying it as the % of stocks is falling. The idea is to load up on the way back above 20%.
It's not perfect, especially when volatility spikes, as is normally the case in these environments.
But it's a great rule of thumb that is right at the top of my mind right now.
Another thing worth mentioning here is that I'm specifically interested in the NYSE listed stocks, and not just the S&P500.
I really like the diversity of the NYSE with all its international exposure, as well as its composition of smaller-cap stocks.
The S&P500 is just a bunch of humongous American companies.
For the purposes of this exercise, we want to (or at least I want to) focus on the NYSE listings.
Go get 'em!
JC
Research + Execution
The Breakout Multiplier System was specifically designed to take the very best of Allstarcharts Research and build trades to maximize the opportunities found by the entire Research Analyst Team.