This is a major development in the forex market. And when we look under the hood, things are even worse than they appear for the greenback.
With more and more global currencies showing relative strength each day, it’s time to take a look at US dollar internals and see what’s moving.
Relative strength is not just the cheat code for stocks, it also works for the currency market and everything else in between.
We also learn a lot about the breadth of a given market through analyzing internals. This helps us determine how we want to position ourselves to make money.
And right now, it looks like we should position ourselves for a lower dollar over longer time frames.
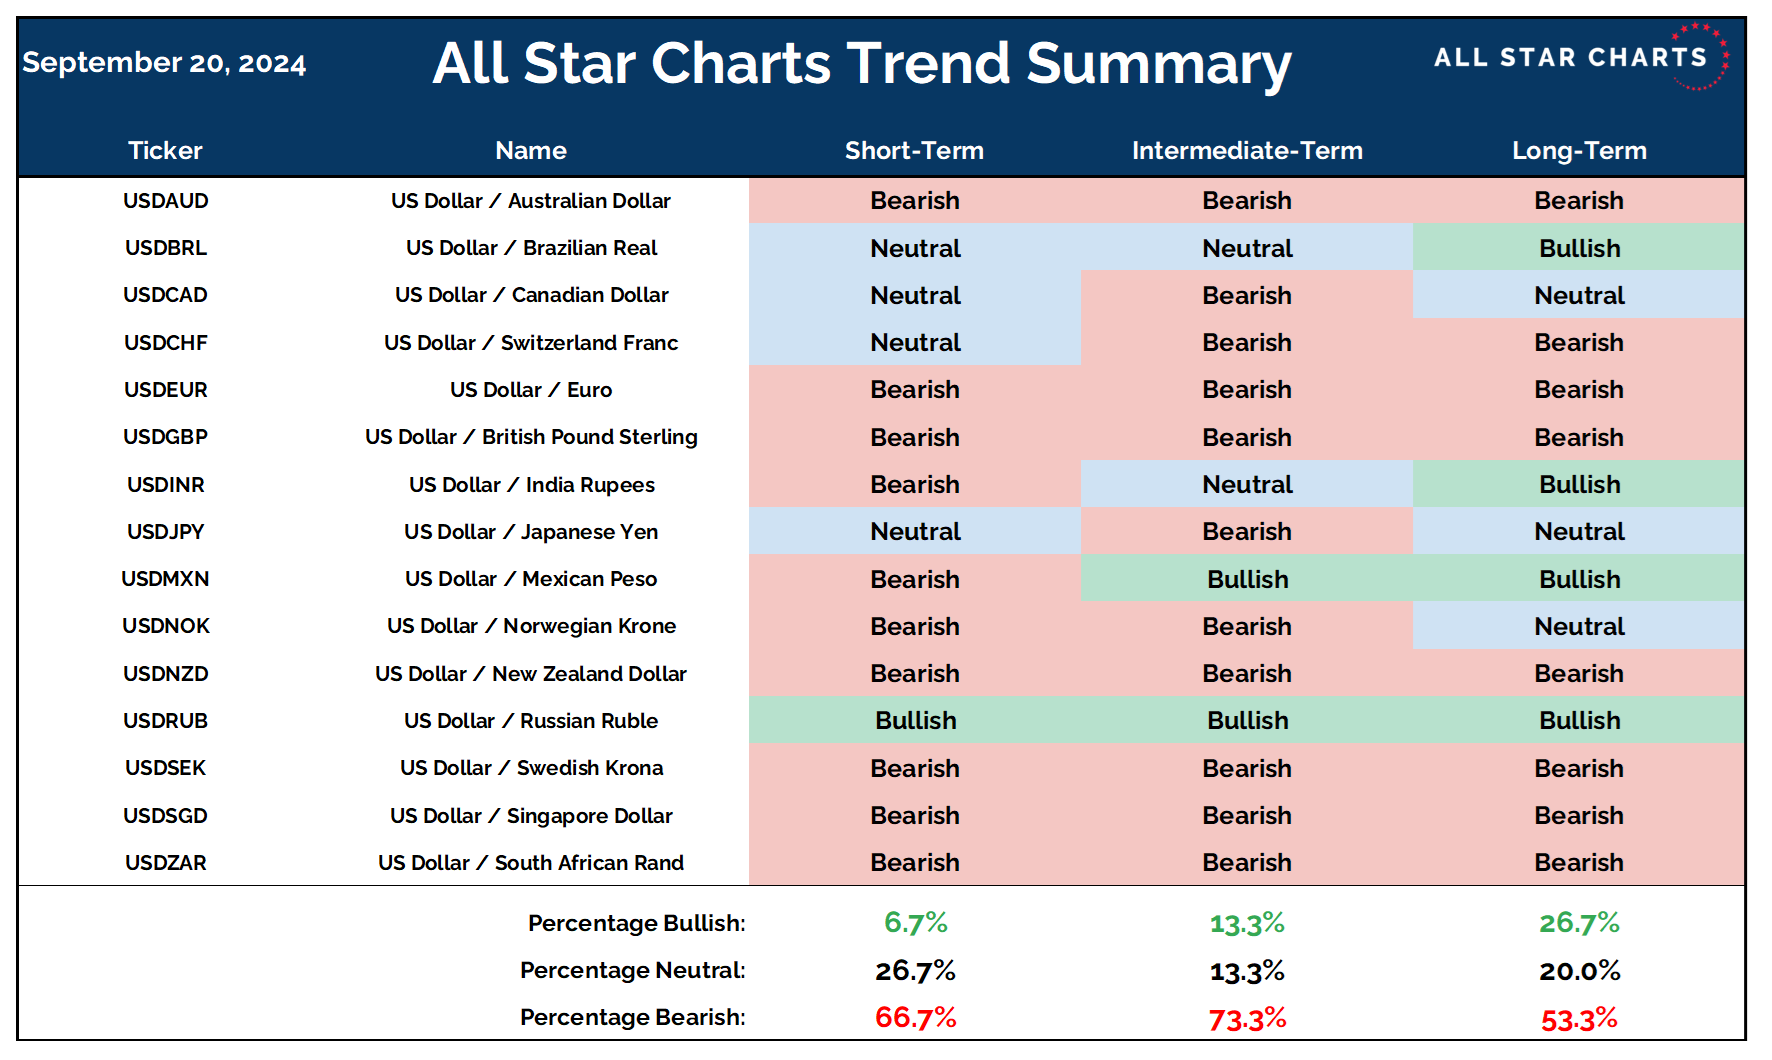
The following table shows the US dollar is in, or moving toward, a bearish trend regime against most other major currencies.
As you can see, over 60% of currencies are in uptrends against the dollar… and this is now true onevery timeframe we analyze.
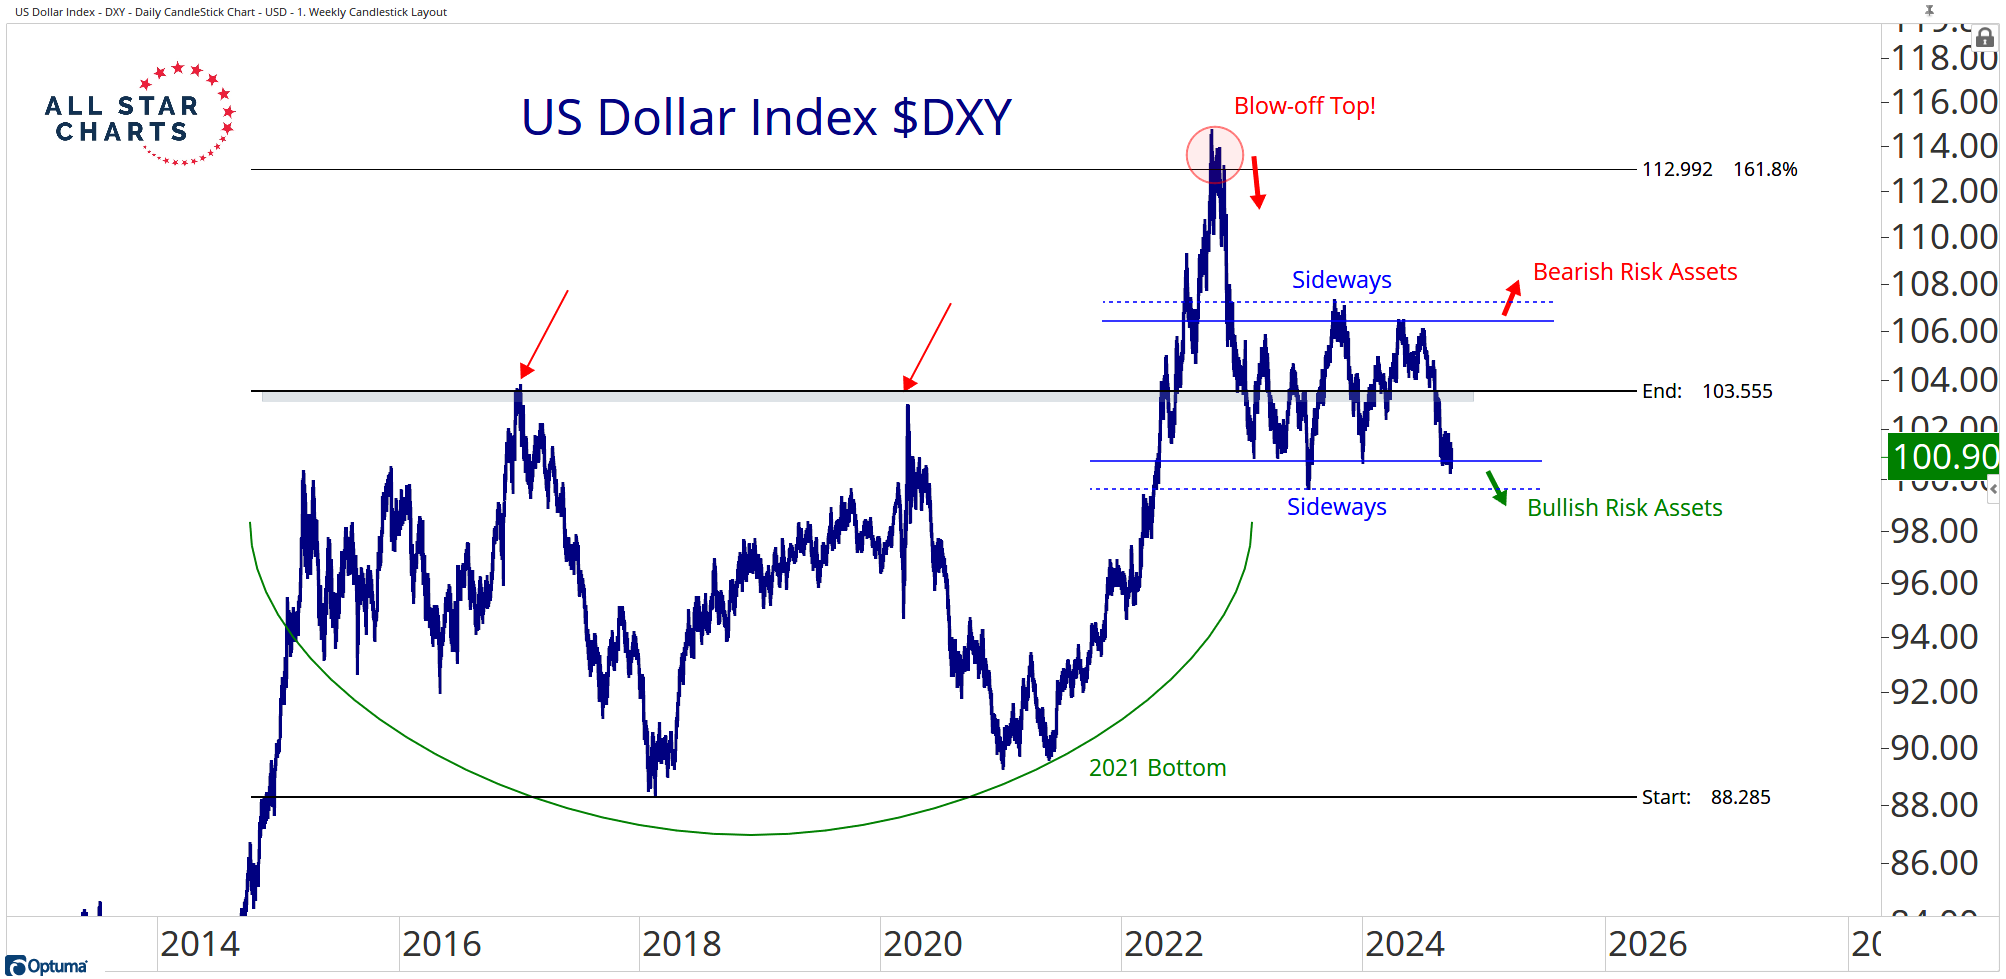
This is a major shift from what we have seen for the last 3 years. Back in 2021, the dollar bottomed out and ripped higher. This move eventually culminated in a blow-off top in Q4 of 2022.
However, since that peak, the dollar has been stuck in a sideways range. Instead of downside follow-through and a new downtrend, DXY transitioned to a trendless state and has remained that way for nearly two years.
When we zoom out from this range, we can see the dollar is below a shelf of prior-cycle peaks from 2016 and 2020. Not only is it trapped beneath this overhead supply zone, but DXY is not bouncing off of these levels as we’ve seen it do in the past.
So, what’s next for King Dollar?
We think the odds are in favor of DXY breaking down here.
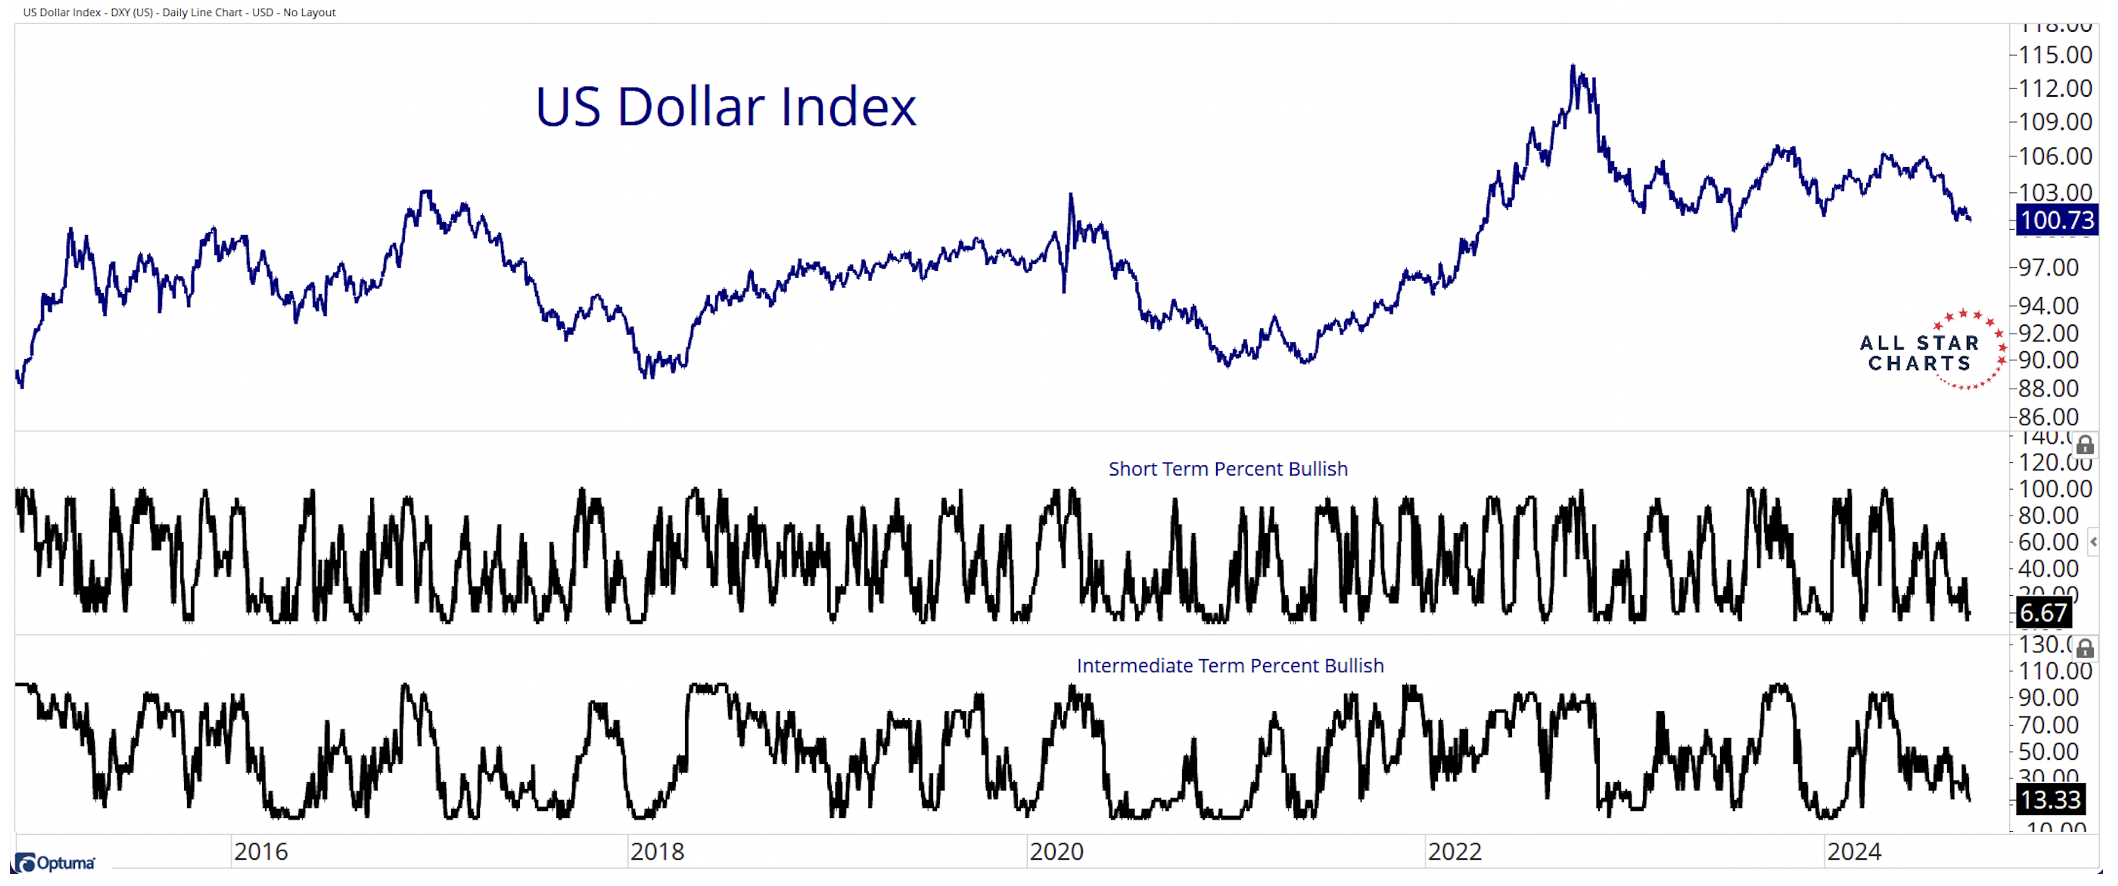
The dollar index has been moving sideways for over a year and one could argue these are the weakest internals we’ve seen in that time. The percent bullish trend readings for the dollar against other currencies continue to move lower as DXY churns at the lower bounds of its range.
And when we put internals aside, the price action alone is dictating a downside resolution.
One of the major principles of technical analysis is that the more times a level is tested, the more likely it is to break.
If this holds true, the dollar could be on its last leg.
Every time the dollar hits this support level around 100, we get a bounce. This is the 5th time it has been tested in two years.
Eventually, sellers absorb all the demand, and support gives way. We think this is coming any day now.
We’re looking for a weekly close below 99.50 to confirm a downside resolution from this rectangle pattern.
This move would also lift stocks, gold, and other commodities. Even crypto should benefit.
A falling dollar can lift all ships. We’ve seen it before and think it is happening again.
Are you prepared for it?
You won't want to miss this!
The first ASC Mastermind class is tomorrow at 4:00 pm ET.