Two weeks ago, we couldn’t help but discuss the impressive move out of the silver/gold ratio, pointing to risk appetite in the precious metals space.
Now, gold’s crazy little cousin is pressing up against new 52-week highs.
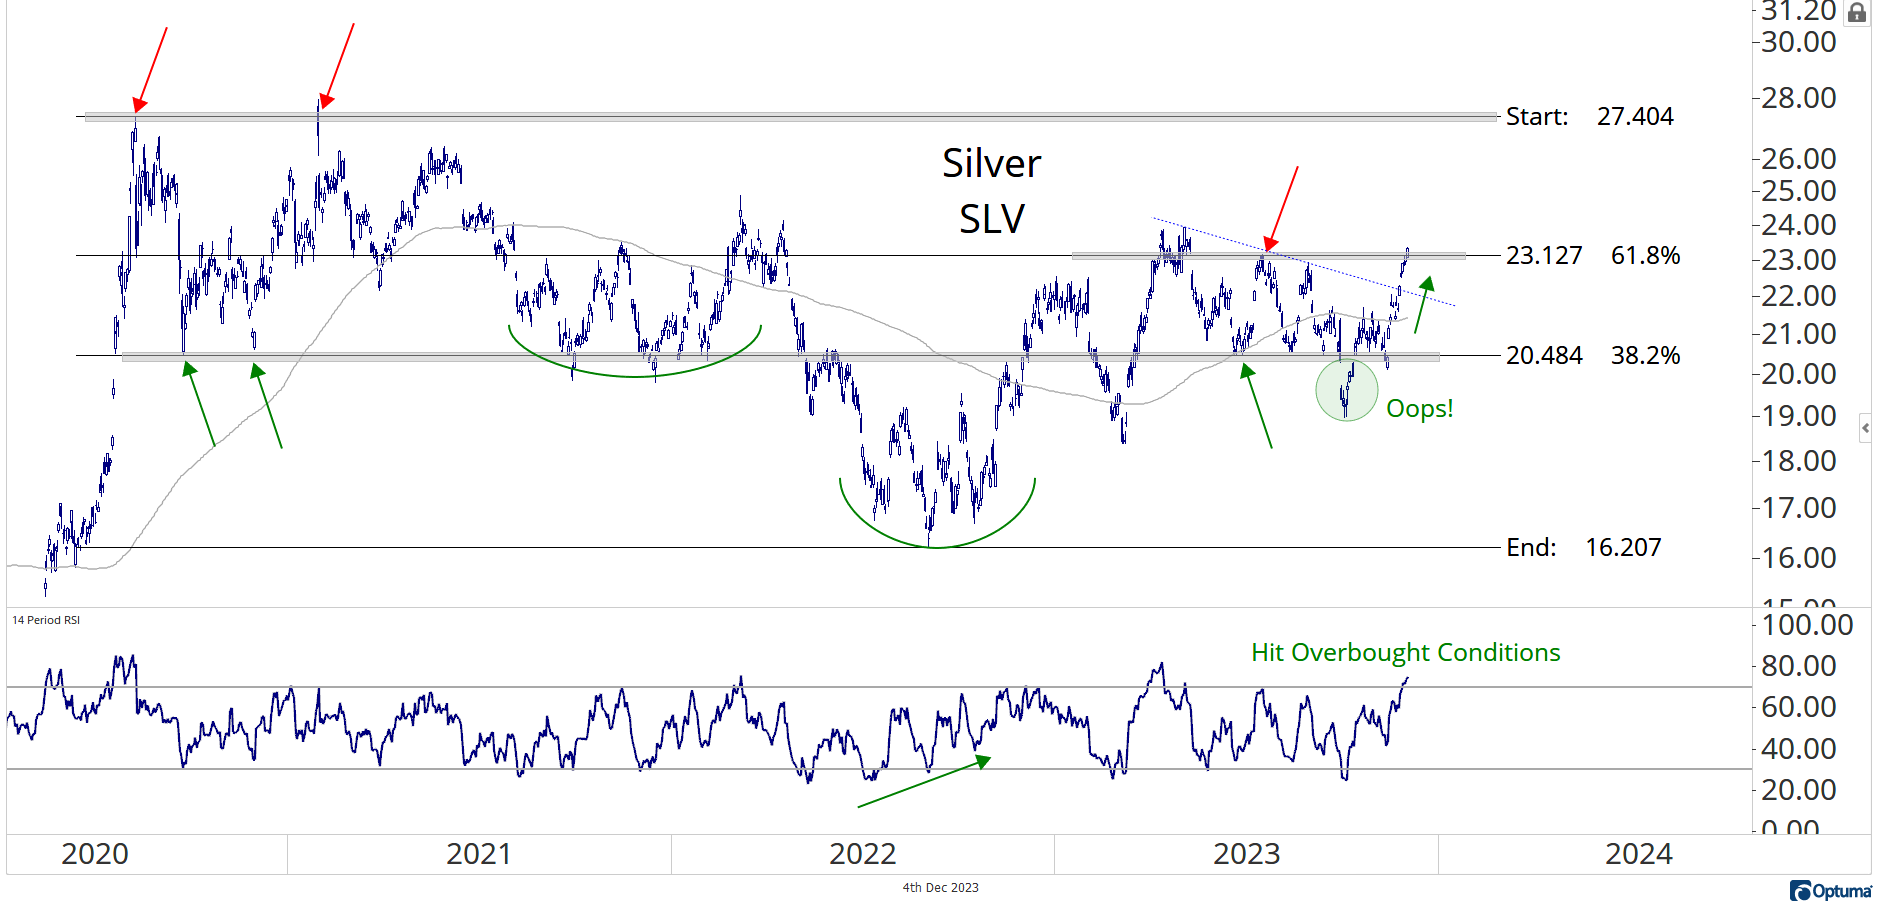
Just check out the chart of BlackRock’s Silver ETF $SLV rallying into this key inflection point near 23:
Not only does this level coincide with the 52-week highs proceeding a seven-month consolidation, it also represents the 62% Fibonacci retracement of this three-year range.
Make no bones about it, this is a critical level we’re watching in silver right now.
Should we see buyers continue to push the metal higher above this level, it would confirm a breakout.
Above 23.10, we like SLV long with a target at the former highs of 27.40.
But it doesn’t just stop there; let’s plan ahead into the future.
With gold again flirting with all-time highs, we’re on the cusp of a new bull market in precious metals.
In a world where silver goes on to hit our initial target of 27.40, we’ll like the setup even more than we do today.
Because once silver is back to these levels, it’ll be right on the edge of a three-year breakout.
It doesn’t get much more bullish than that.
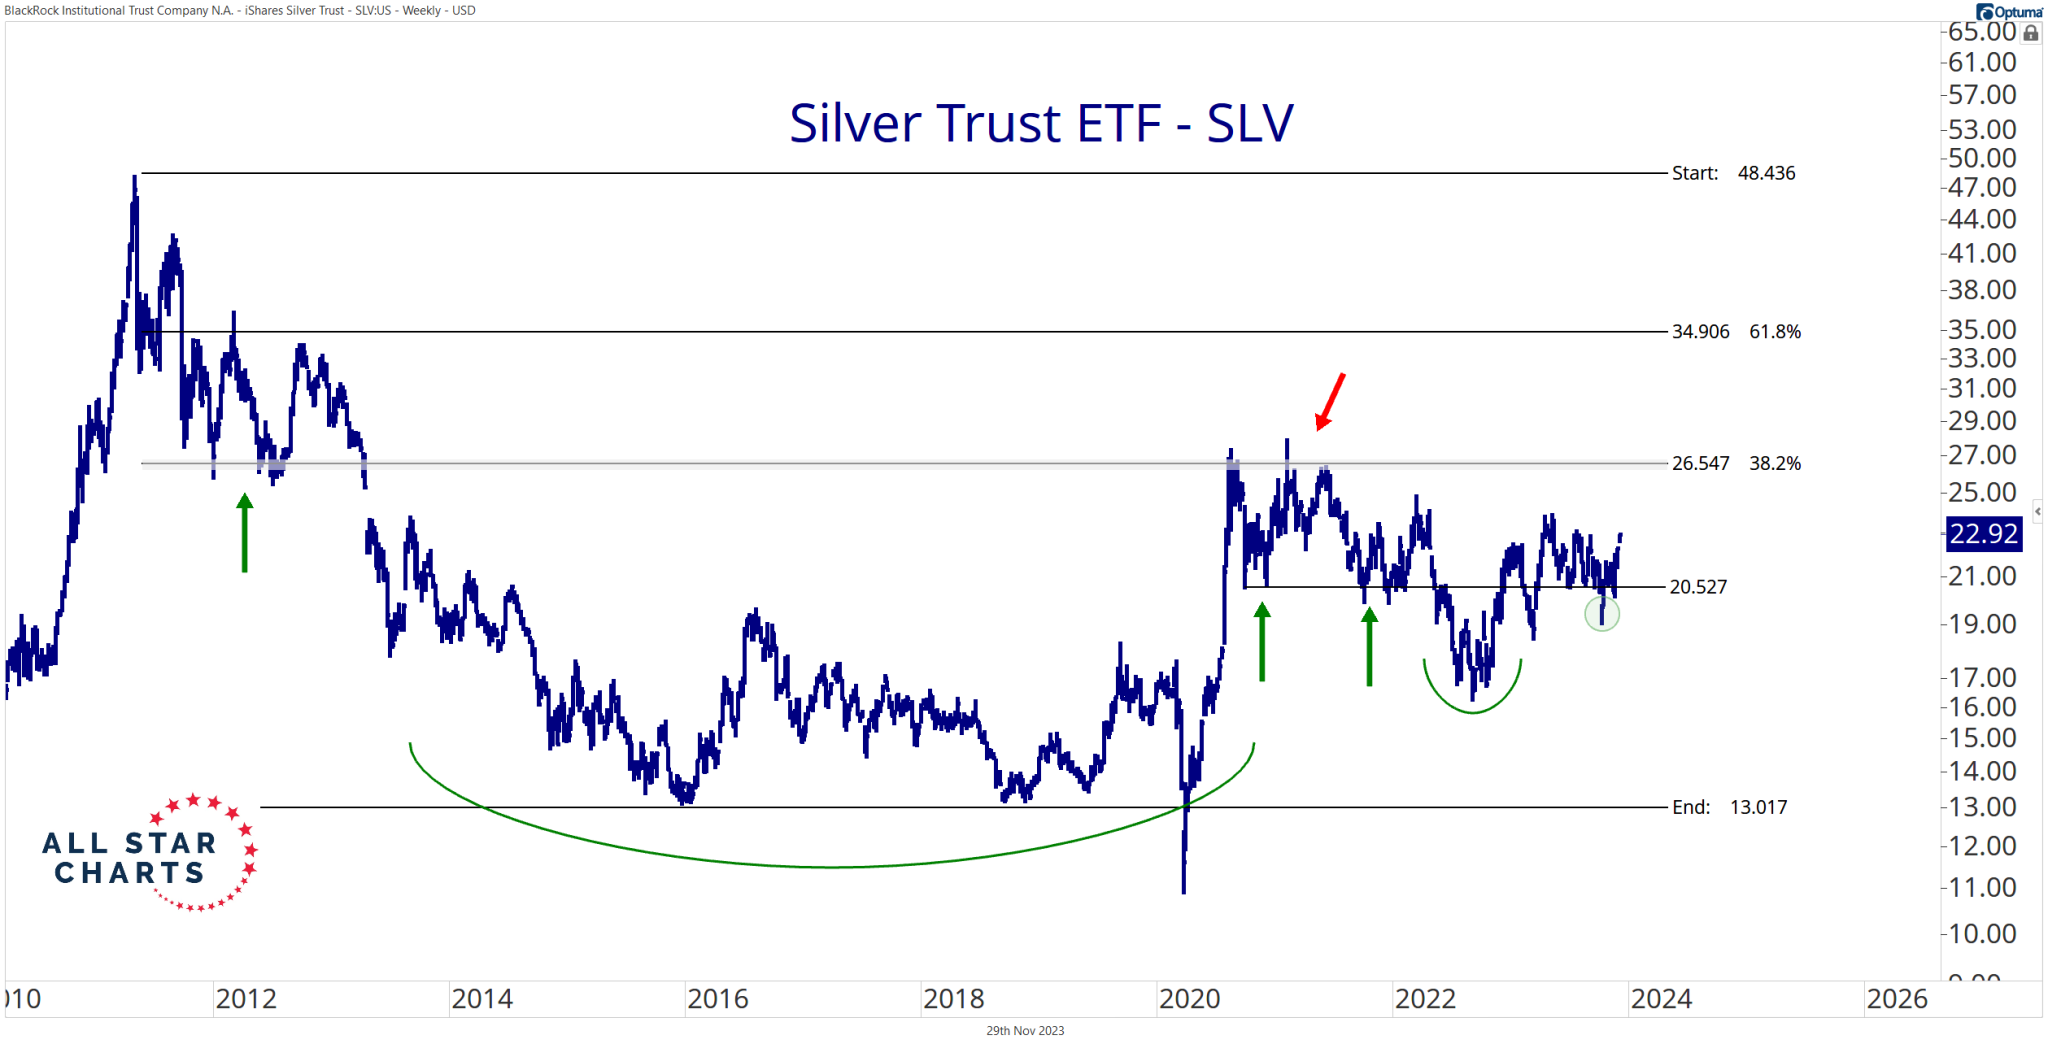
Here’s a zoomed-out look at SLV:
Provided silver hits our first target, we can set a secondary target of 34.90, which is nearly 50% of upside from current levels.
For now, our attention remains steadfast on the pivotal 23 level for silver.
Gold Rush Report highlights the breakout setups, rotations, and technical signals shaping metals markets — giving traders an edge in gold, silver, and commodities.