Stocks Priced in Real Money (Dow vs Gold)

Alright guys. Enough is enough already. The question that we need to be asking ourselves is NOT whether we think Gold is going higher in Dollar terms. It is a worthless academic exercise to keep coming up with ridiculous price targets for Gold. Do I hear $2,000? $3,000? I heard yesterday, someone say $5,000. What is the point? Might as well make it a Million.
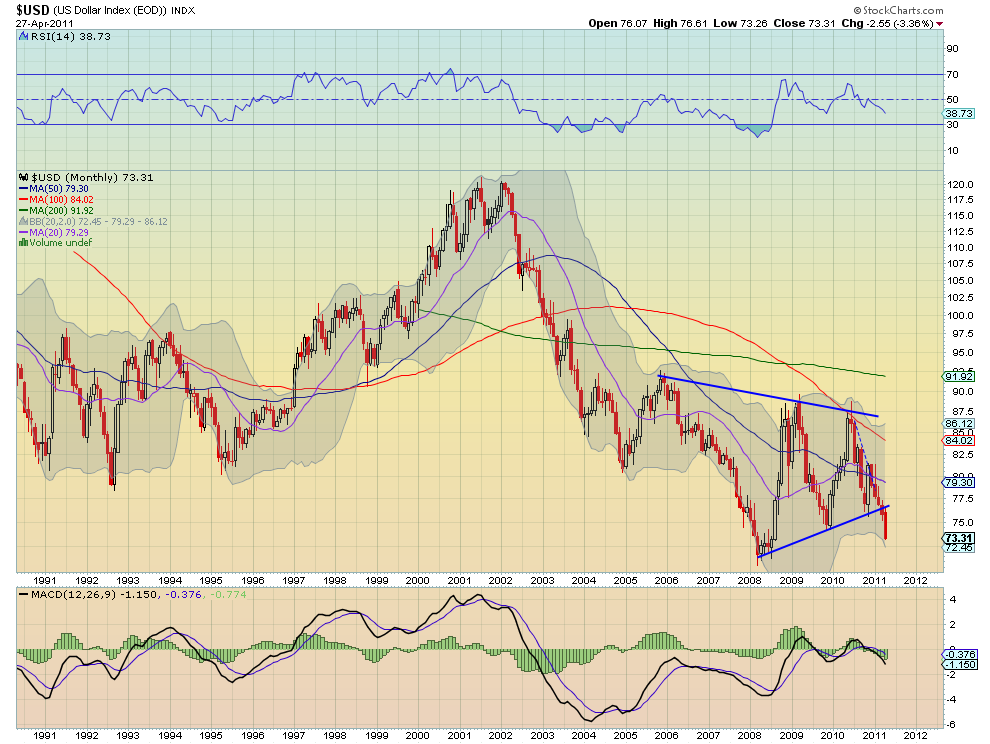
In case you didn't get the memo, the value of the US Dollar has been going down for a decade. Gold is priced in US Dollars, $1530 US Dollars per ounce last I checked. But if the denominator (in this case the Dollar) keeps losing value, then of course the numerator in the ratio will continue to accelerate higher (Gold in this case). Same thing with Stocks, valued in US Dollars. Sure the Dow Industrial Average is making new highs, but relative to what? The Dollar? Oh terrific.
What I think is more important, and more relevant, is to use Gold here as the Denominator. Ben Bernanke cannot create Gold Bars. He can't just pull the lever (See TRB) and create more Gold. So let's look at Real Prices here - Stocks vs Gold. We'll use the Dow Jones Industrial average to keep our usual 'Keep it Simple' Mantra.
In 1980, One share of the Dow Jones Industrial Average bought you One ounce of Gold, about $800. This was a 1:1 Dow:Gold Ratio. What too many people are forgetting is that over the next 20 years, this is the ratio that exploded. By the turn of the century, 20 years later, One share of the Dow bought you 44 Ounces of Gold. The 1:1 ratio in 1980 got to 44:1 by 1999. THAT is the bubble that popped at the turn of the century that you don't hear people talking about. Why not? I have no idea. Peter Schiff has been all over this for a while.

Right now this ratio is sitting around 8:1. In other words, One share of the Dow only buys you 8 ounces of Gold. This is much lower than the 44:1 in 1999. The trend here is clear. Stocks are buying less and less Gold as time is going on. Historically speaking, trends in this ratio don't last for weeks or months or even years, they last for decades. And based on just price action alone, there is zero evidence of this trend completely reversing and begin heading higher. In fact, all signs are pointing towards getting closer to that 1:1 ratio. We don't want to make ridiculous predictions here, like our Gold to $5,000 buddies. But it is important to recognize that this is a big and powerful trend that currently in place. It cannot be denied. Ignore it if you want. But I think you're doing yourself a huge disservice by dismissing it.

This is a closer look at this ratio. RSI still bearish. No signs of a reversal. That declining 200 week moving average is like having Ray Lewis sitting there waiting to crush you the minute you cross that line of scrimmage (See Here in case you don't know). Yes watch the Stock Market. But just remember that if you price stocks in something that keeps losing value because of Government intervention, you're ignoring a critical factor. Watch the Dow/Gold ratio. It's an important one and it's trending lower until further notice.
Related Posts:
https://allstarcharts.com/media-breakout-on-yahoo-finance/
https://allstarcharts.com/gold-prices-inflation-adjusted/
Historic Dow/Gold Chart courtesy of www.thechartstore.com
