The S&P 500 posted back-to-back -4% down days last week.
Here’s the chart:
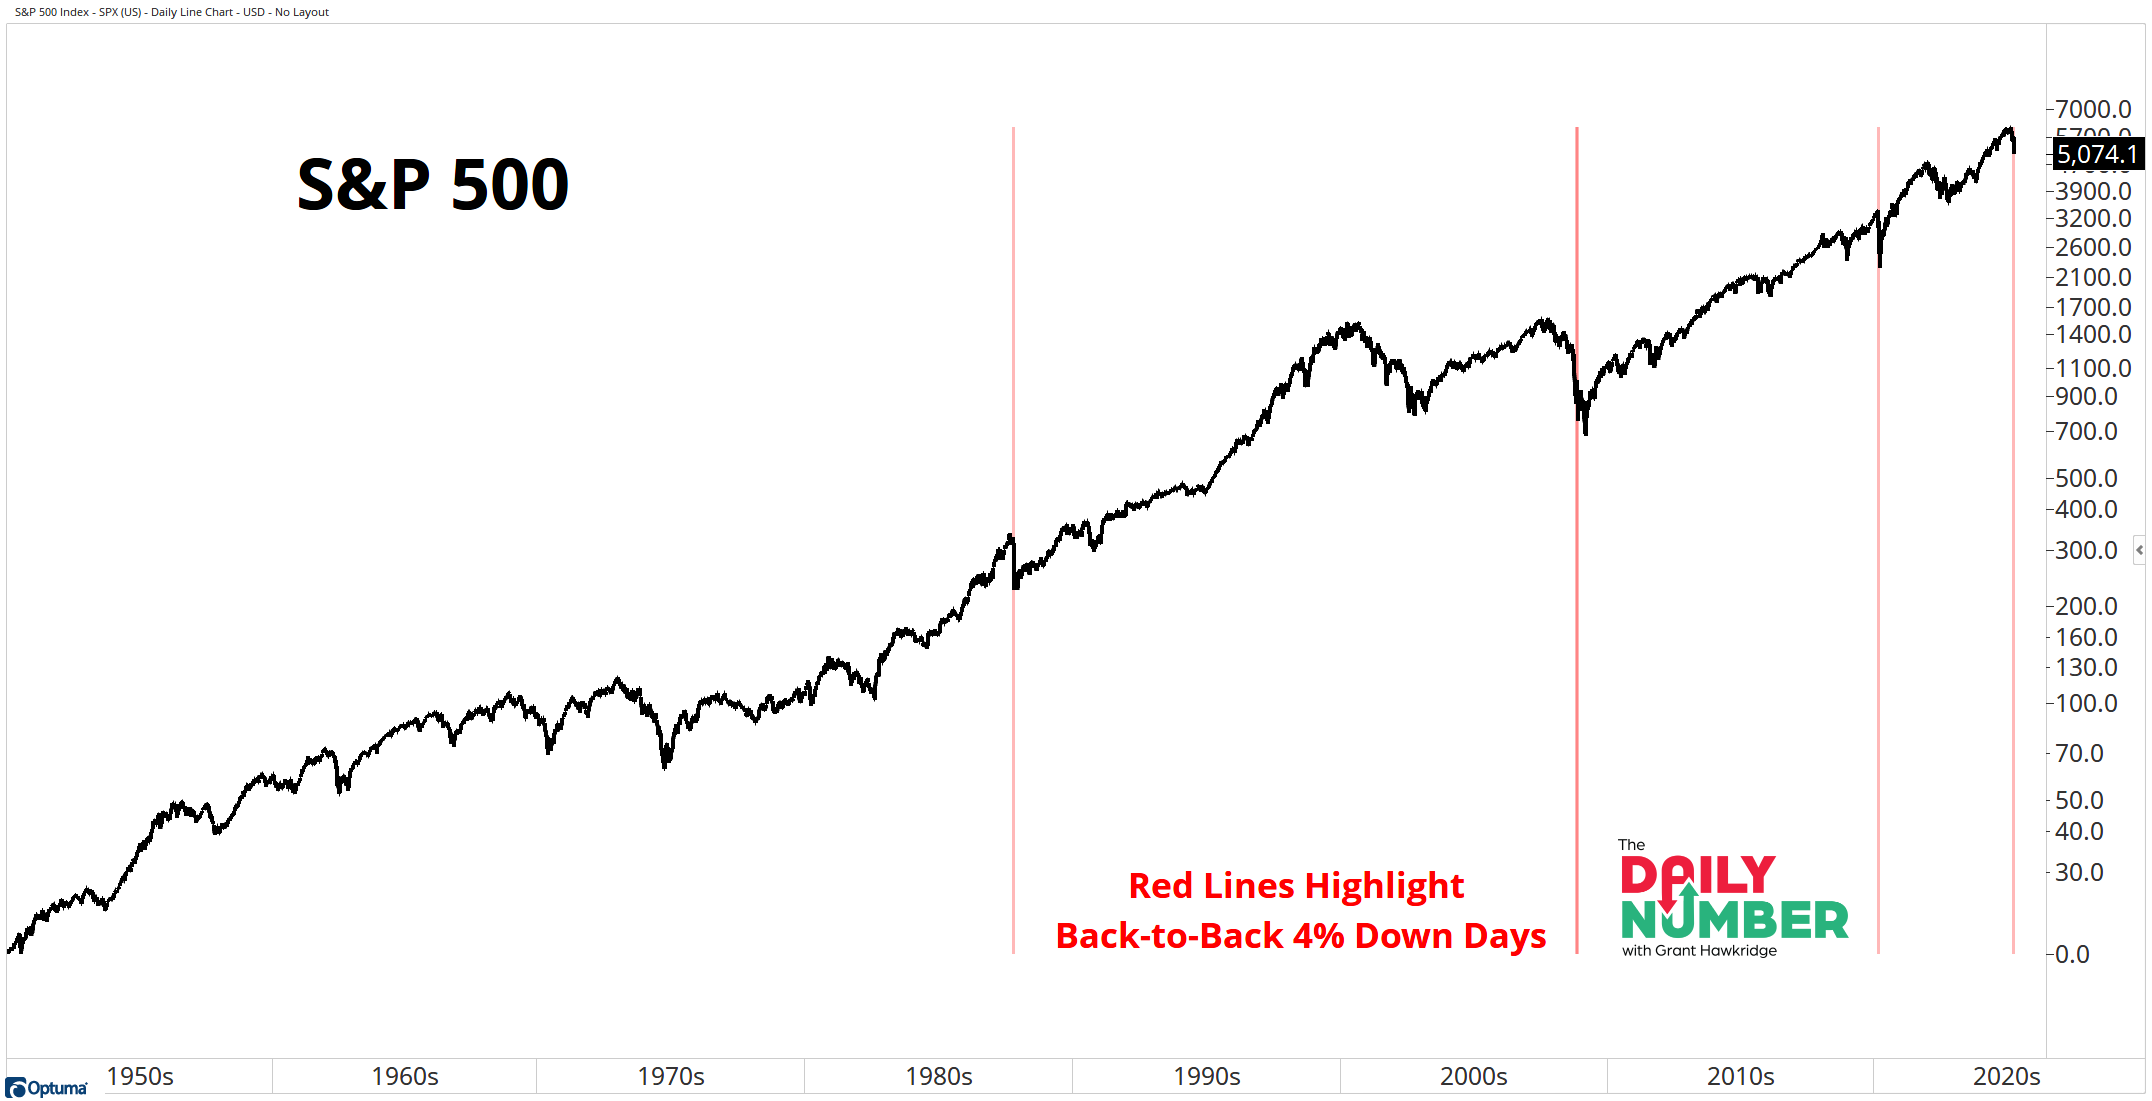
Let's break down what the chart shows:
The black line is the S&P 500 index price.
The red lines highlight the days the S&P 500 posted back-to-back -4% down days.
The Takeaway: At the end of last week, we experienced some significant daily declines. On Thursday, the market fell by 4.8%, and things worsened on Friday, with a decline of 5.9%.
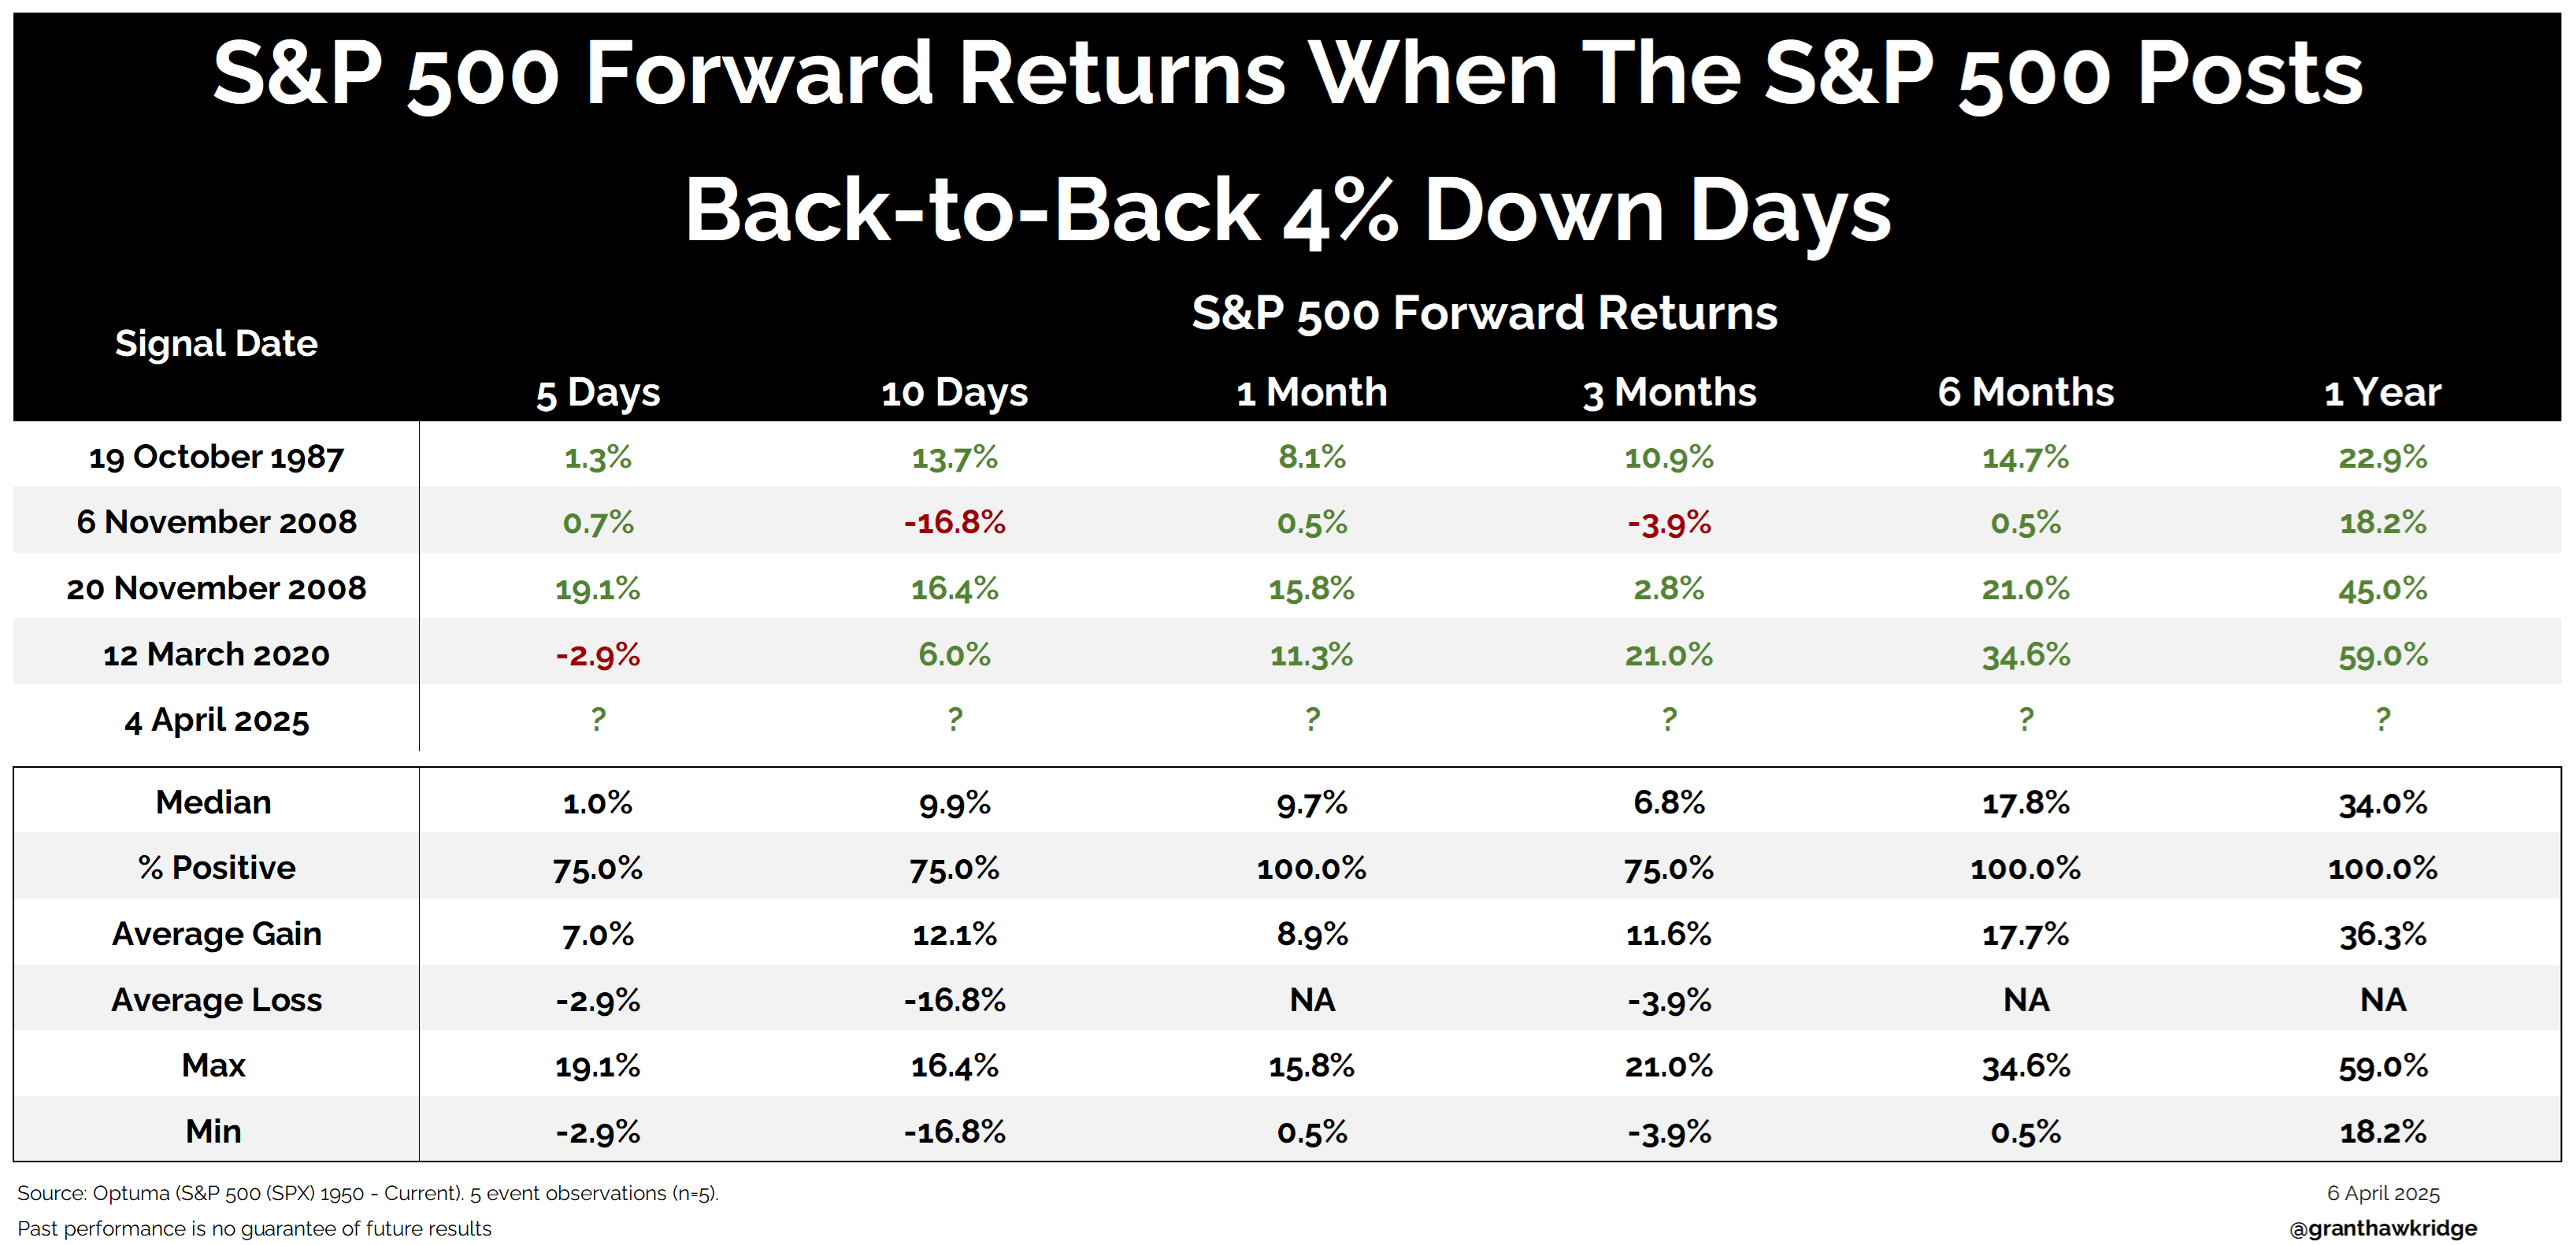
When we take a look at the data, consecutive days with drops of -4% or less are relatively rare. However, this kind of weakness in a bear market could indicate that the worst may be behind us.
It's important to keep in mind that the sample size is small, so we should approach this information cautiously. Nonetheless, historical data tells us that after such big back-to-back declines, future returns tend to be very strong.
On average, one year later, stocks typically rise by over 30%.
If you find my content valuable, I would greatly appreciate it if you could share it with your friends, family, and colleagues. Your help in spreading the word is invaluable in supporting our work. Thank you to all of you who share!