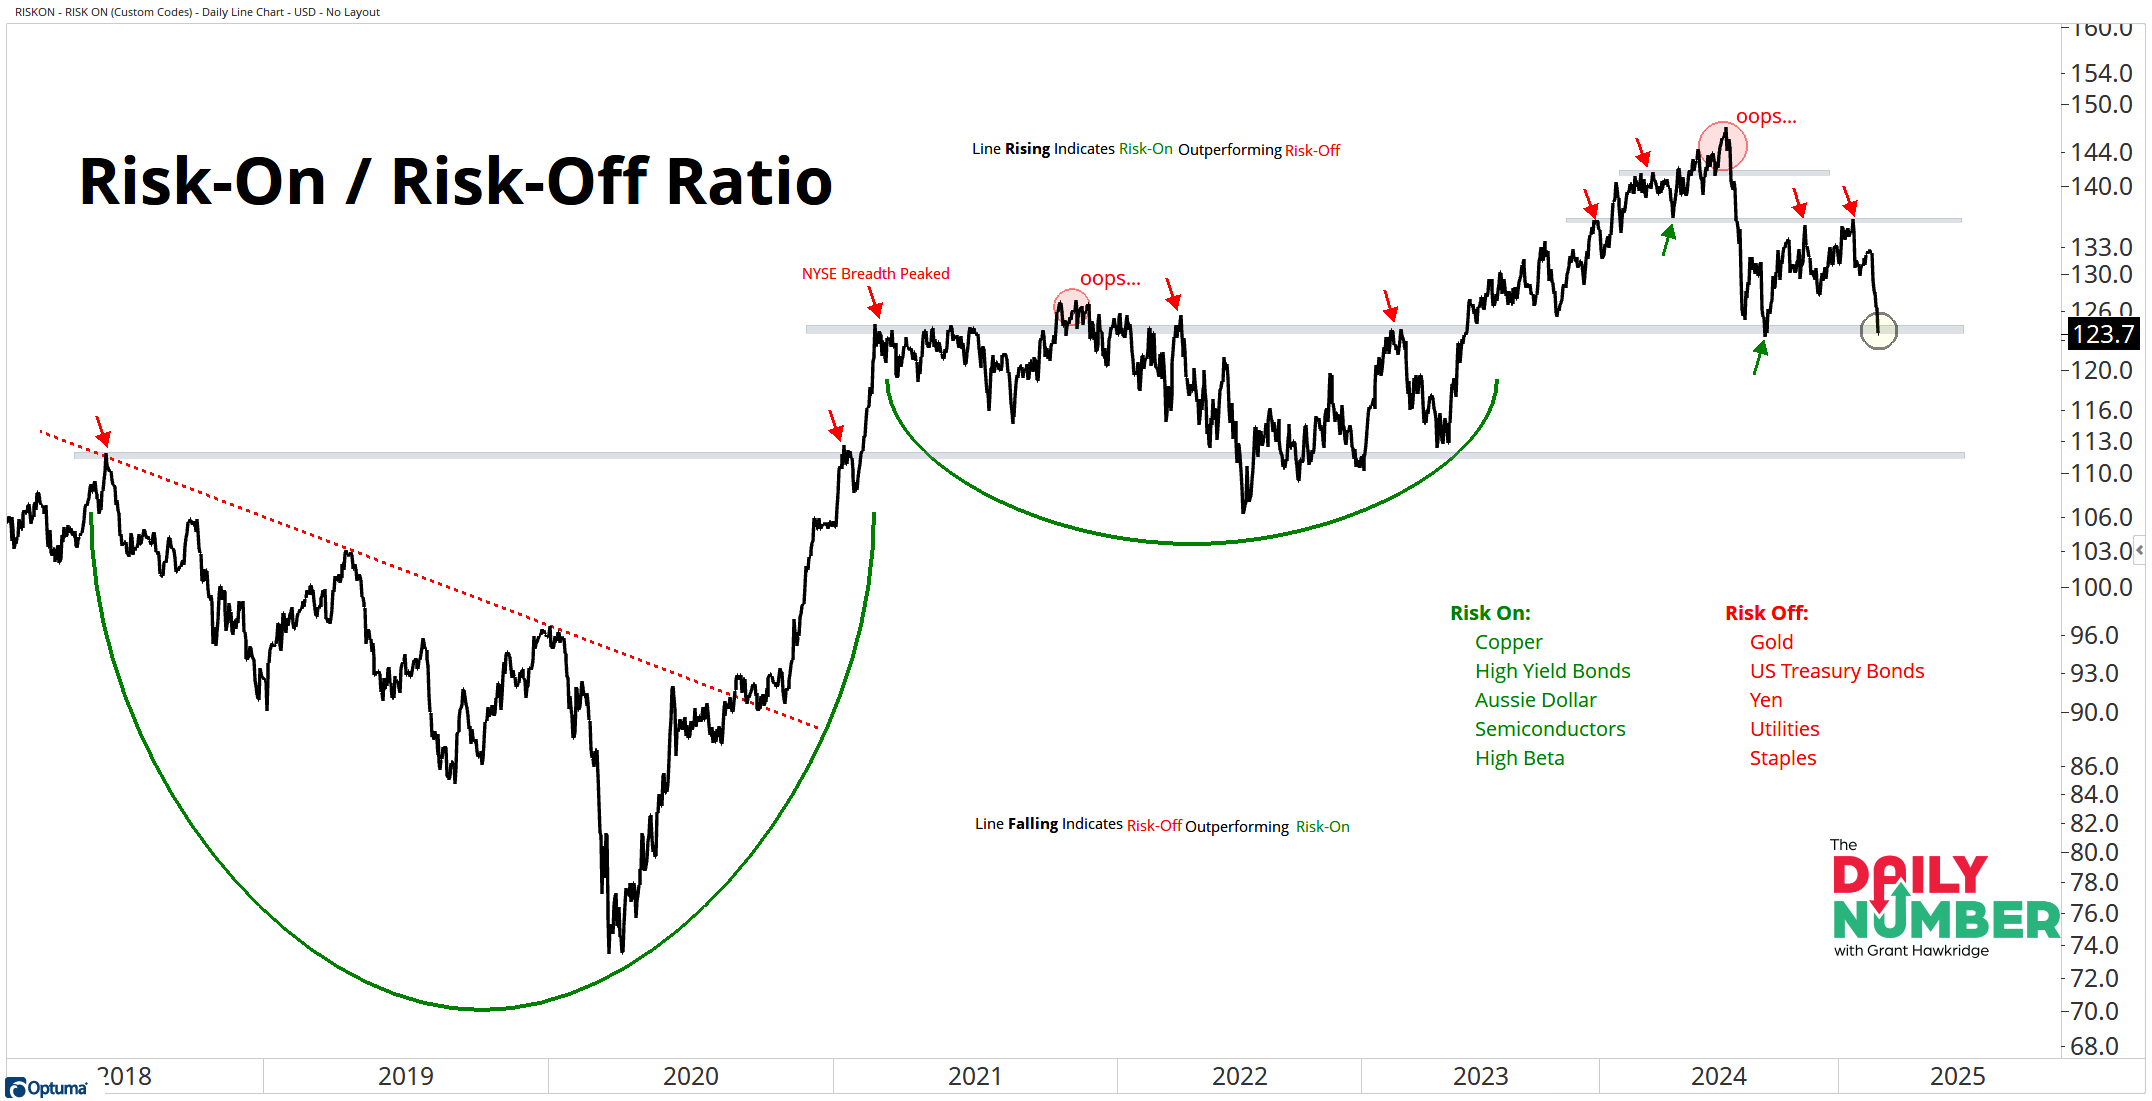
My Risk-On/Risk-Off ratio has sharply declined recently and returned to levels when the ratio peaked and fell into a consolidation period back in 2021.
Here’s the chart:
Let's break down what the chart shows:
The black line is my Risk-On/Risk-Off ratio.
The Risk-On components consist of Copper (HG1), High Yield Bonds (JNK), Aussie Dollar (AUDUSD), Semiconductors (SOXX/SPY) & High Beta (SPHB/SPY).
The Risk-Off components consist of Gold (GC1), US Treasury Bonds (TLT), Yen (JPYUSD), Utilities (XLU/SPY) & Staples (XLP/SPY).
The Takeaway: Investors are experiencing fear and pessimism, as bearish sentiment dominates the surveys. The US market is beginning to mirror this mood, showing a preference for a Risk-Off environment. This is reflected in my Risk-On/Risk-Off ratio, which has returned to a key level of importance where we saw NYSE breadth reach its peak in 2021.
Will this resistance level, which has turned into support, continue to act as support, or will this ratio break down?
While there are still opportunities in the market, which JC has been pointing out, it’s important to be selective instead of broad-based buying. My Risk-On/Risk-Off ratio suggests that now is not the right time for an aggressive strategy.
Grant Hawkridge | Chief Aussie Operator, All Star Charts
ICYMI: What happens next in the AI trade? NVIDIA may have just told us. JC, Spencer, and Kenny broke down real-time reactions, key levels to watch, and what this means for big tech moving forward. Click here to watch the replay — and for a limited time, get into Kenny’s Live Trading Room at a discount so you’re never late to the trade.
If you find my content valuable, I would greatly appreciate it if you could share it with your friends, family, and colleagues. Your help in spreading the word is invaluable in supporting our work. Thank you to all of you who share!