The percentage of stocks down 20% or more are expanding across all S&P market caps.
Here’s the chart:
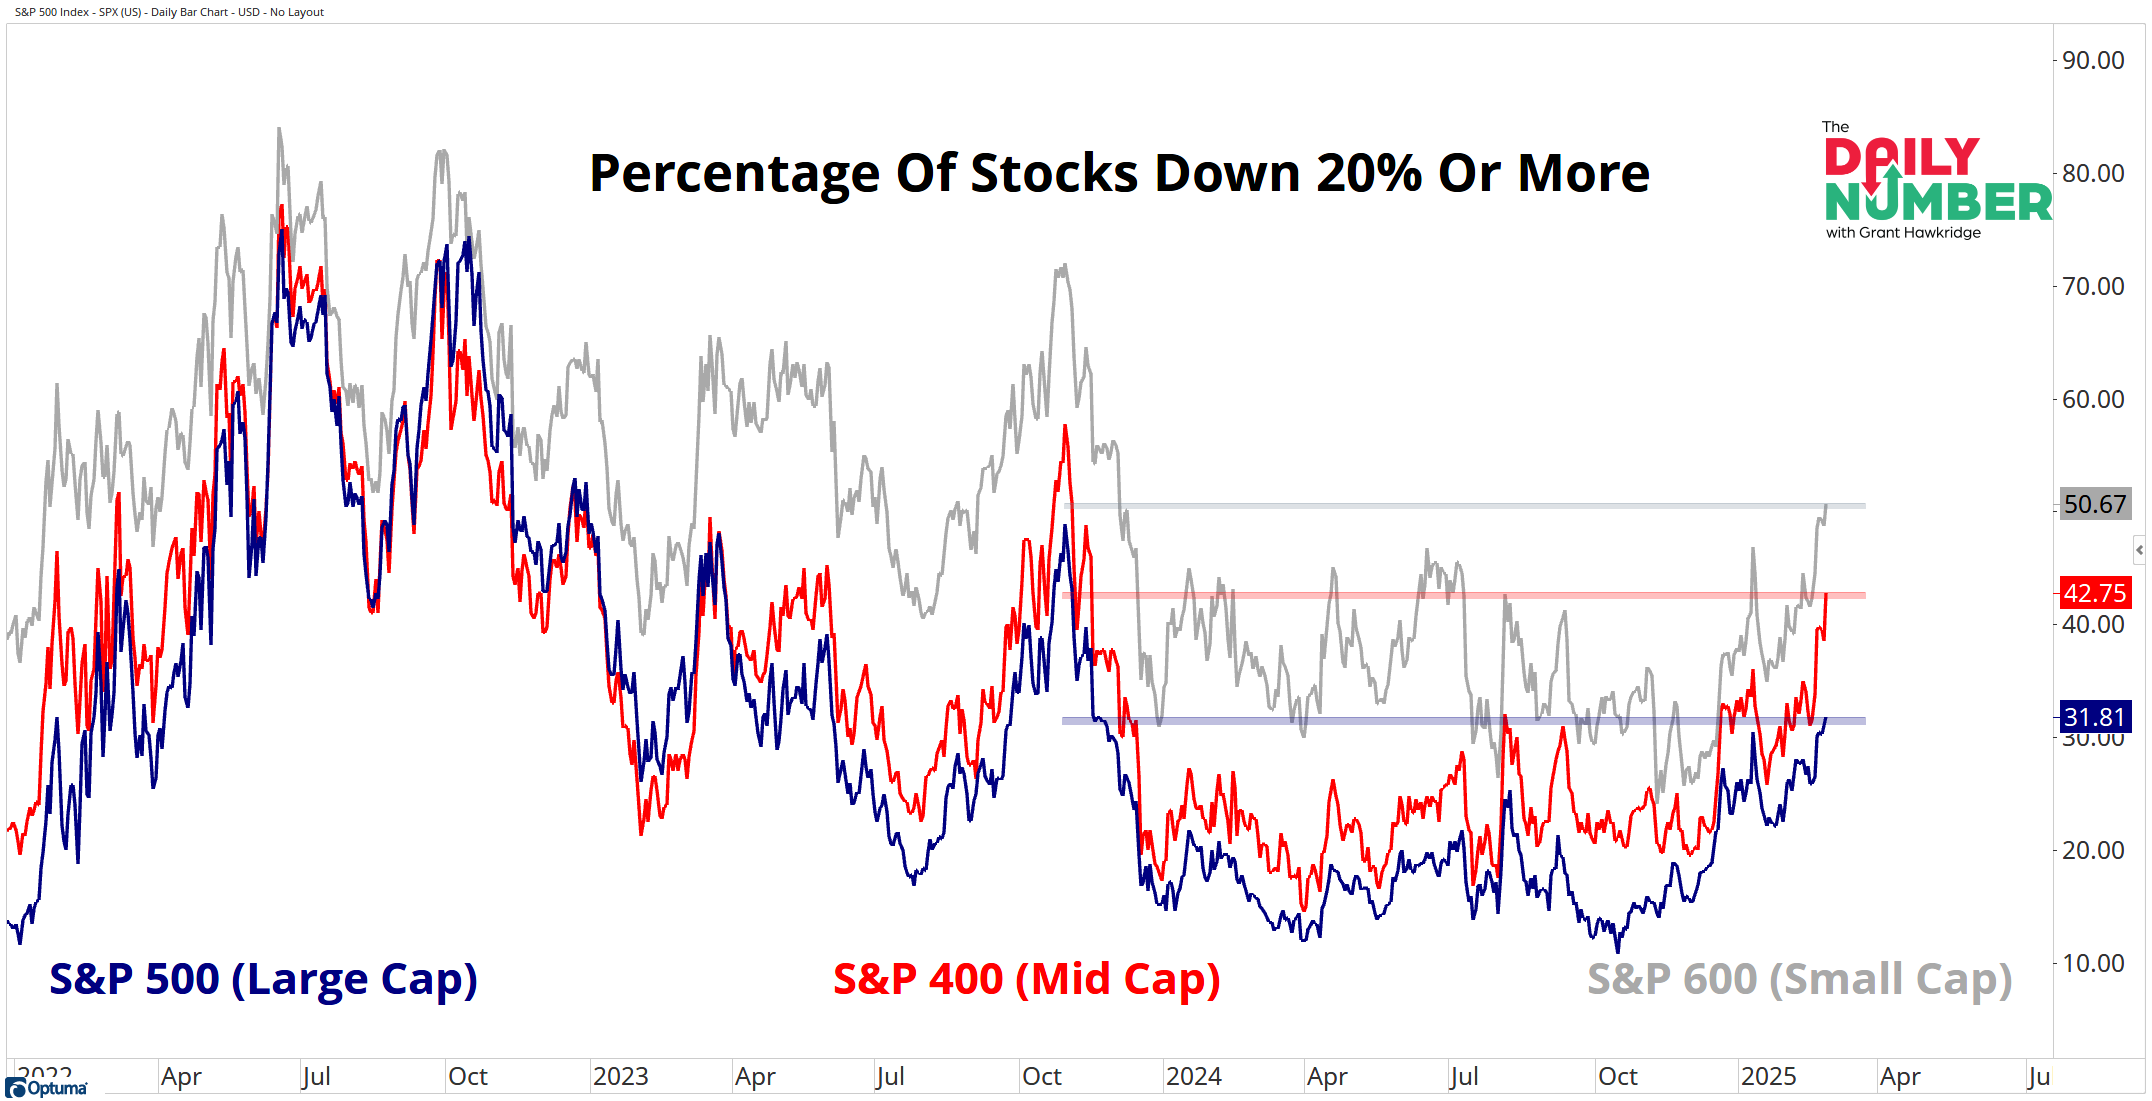
Let's break down what the chart shows:
The blue line represents the percentage of S&P 500 stocks (Large Cap) that have declined by 20% or more.
The red line indicates the percentage of S&P 400 stocks (Mid Cap) that have fallen by 20% or more.
The gray line shows the percentage of S&P 600 stocks (Small Cap) that have experienced a decline of 20% or more.
The Takeaway: A decline of 20% or more is typically considered the threshold for defining a "bear market" While this method isn't perfect, it's a nice round number that often brings the price of the stock down to levels that you never thought you would see again.
When we look beneath the surface using a 20% or more decline as our criteria, we can see that these breadth readings are expanding across all market caps.
More than half of the S&P 600 stocks have declined by 20% or more, marking the highest level seen for small-cap stocks since early December 2023.
In the S&P 400, 42% of stocks are down by 20% or more, which is the highest level for mid-cap stocks since early November 2023.
Additionally, nearly one-third of the S&P 500 stocks have fallen by 20% or more, which is the highest level for large-cap stocks since early November 2023.
Do you think the current bull market is coming to an end?
Will we see a drop of 20% or more at an index level?
Grant Hawkridge | Chief Aussie Operator, All Star Charts
ICYMI: What happens next in the AI trade? NVIDIA may have just told us. JC, Spencer, and Kenny broke down real-time reactions, key levels to watch, and what this means for big tech moving forward. Click here to watch the replay — and for a limited time, get into Kenny’s Live Trading Room at a discount so you’re never late to the trade.
If you find my content valuable, I would greatly appreciate it if you could share it with your friends, family, and colleagues. Your help in spreading the word is invaluable in supporting our work. Thank you to all of you who share!