So is this one of those times where a divergence between the Dow Industrials and Dow Transports leads to a major change in market trends?
Or is it that the Trannies just haven't broken out yet?
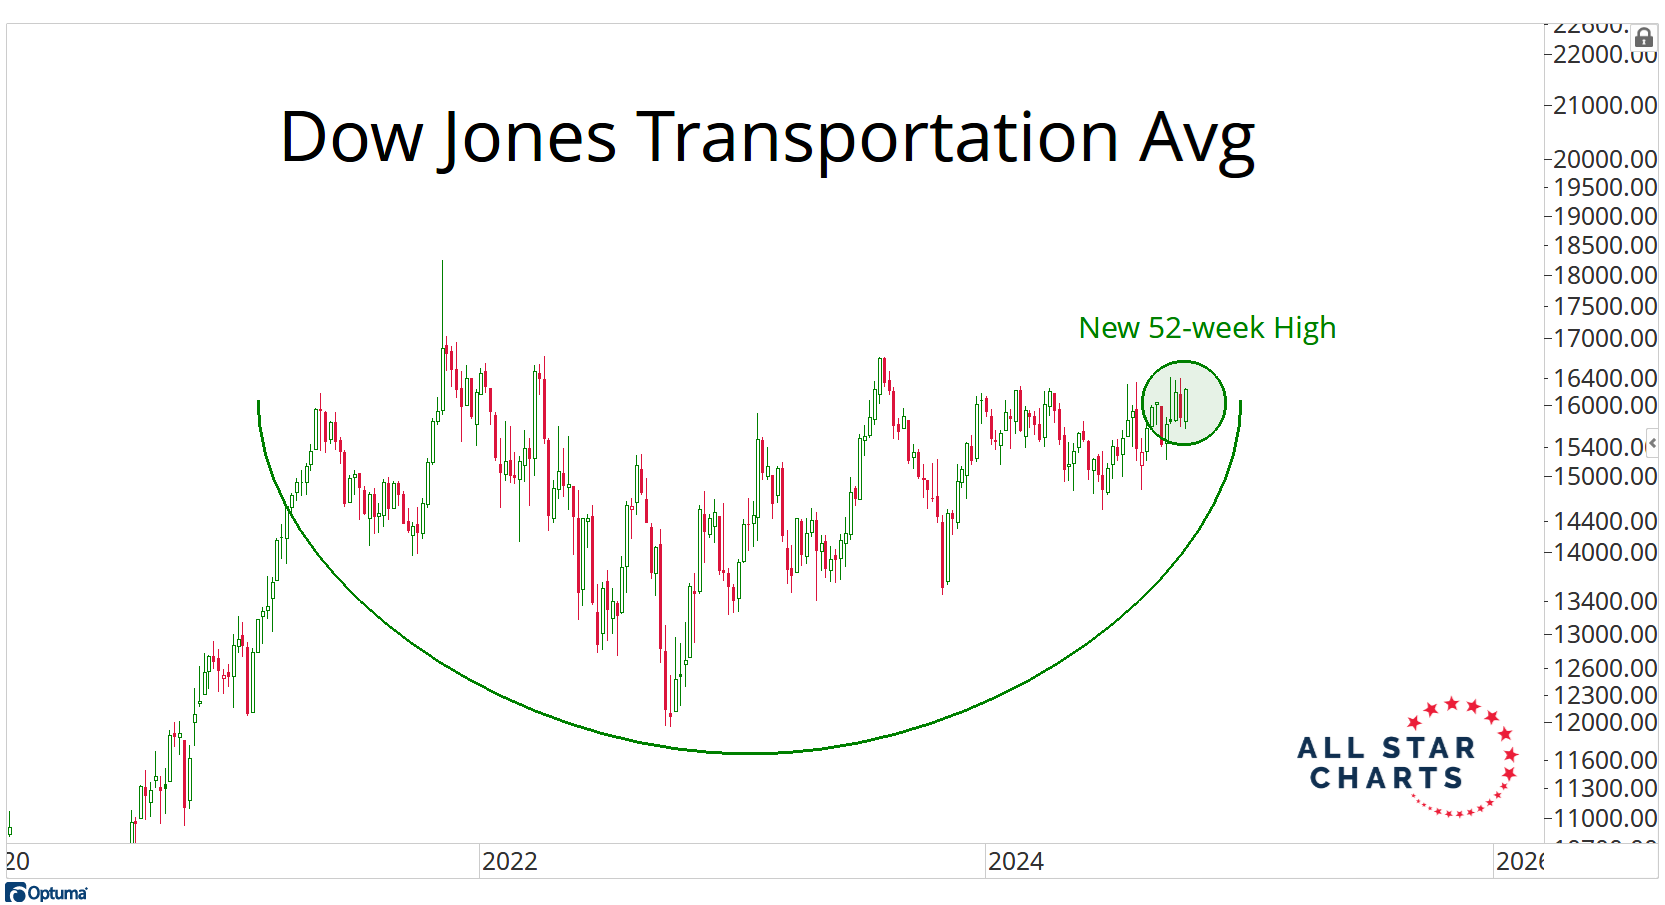
Meanwhile, don't look now but the Dow Jones Transportation Average just joined the Dow Jones Industrial Average on the New 52-week Highs list.
This was the highest weekly close for the Trannies since the summer of '23.
And here's the thing that I've seen investors get a little confused about...
Because it is confusing.
While the DOW JONES Industrial Avg and Transportation Avg are 2 indexes we monitor closely, there's another set of indexes created by Standard & Poor's that we obviously monitor as well.
There are 11 Sector Indexes, which include the S&P Industrials Index.
The stocks in the S&P "Industrials" index include all kinds of engineering and machinery companies, aerospace & defense, and all of the Transportation stocks - where you'll find Railroads, Truckers, Airlines and Logistics companies.
So, in other words, all of the stocks in the DOW JONES Transportation Average are included inside the S&P Industrials Index.
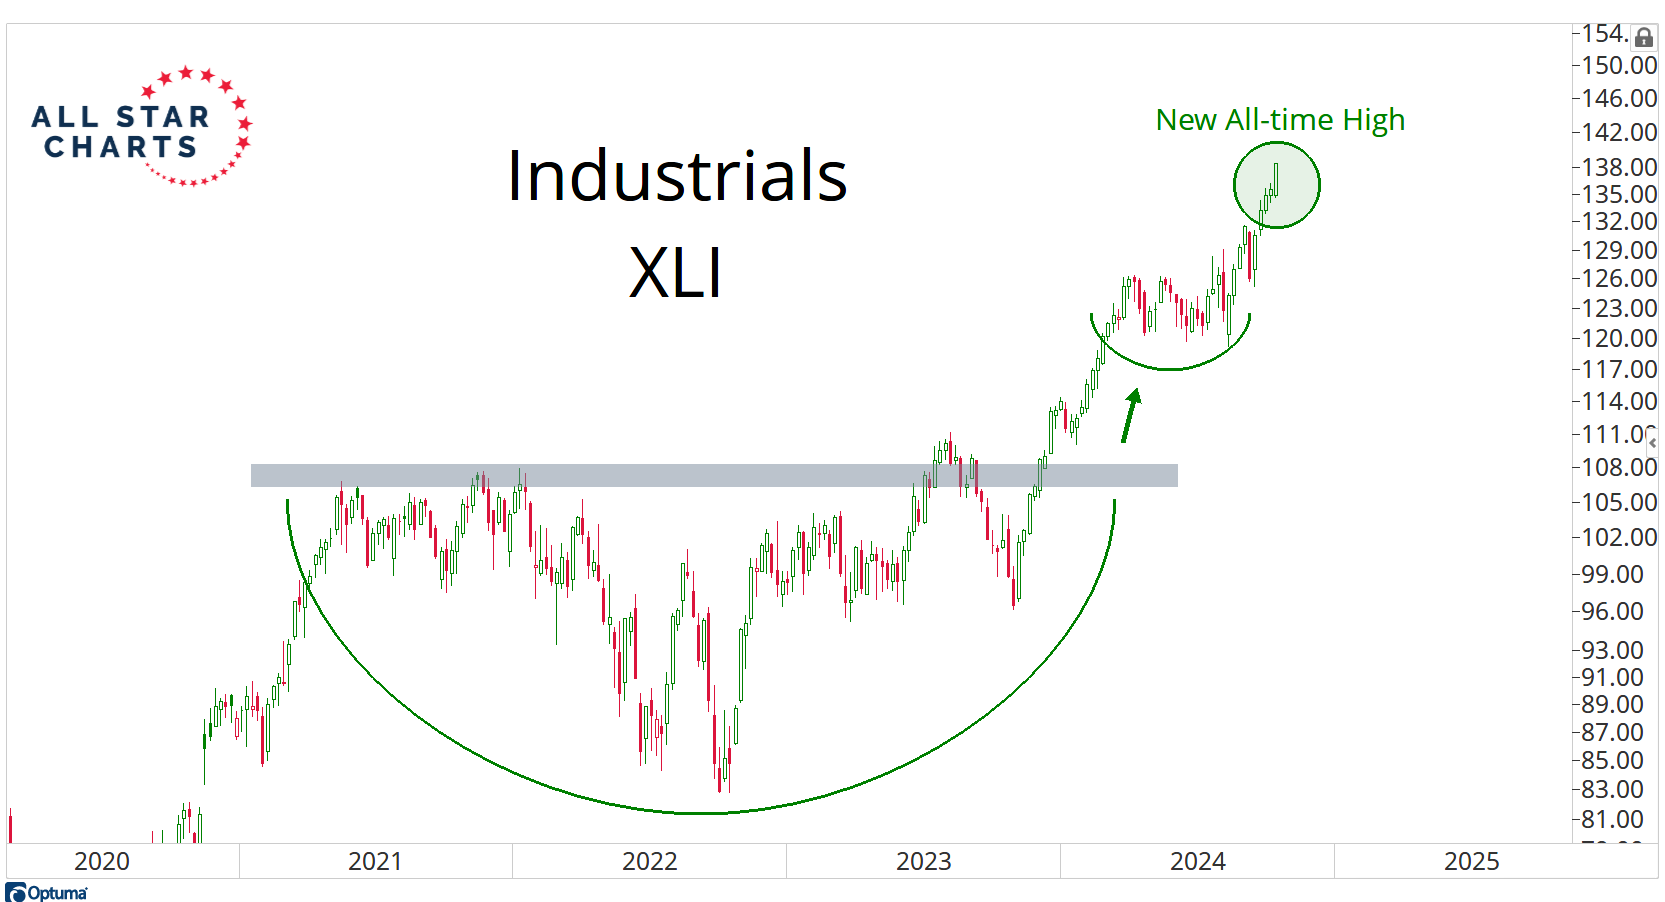
By my work, if we're wondering which way the DJ Transports are heading, then we should take a look at its "parent" sector, and see how that is performing.
Here's what that looks like - already hitting new all-time highs and leading this bull market higher:
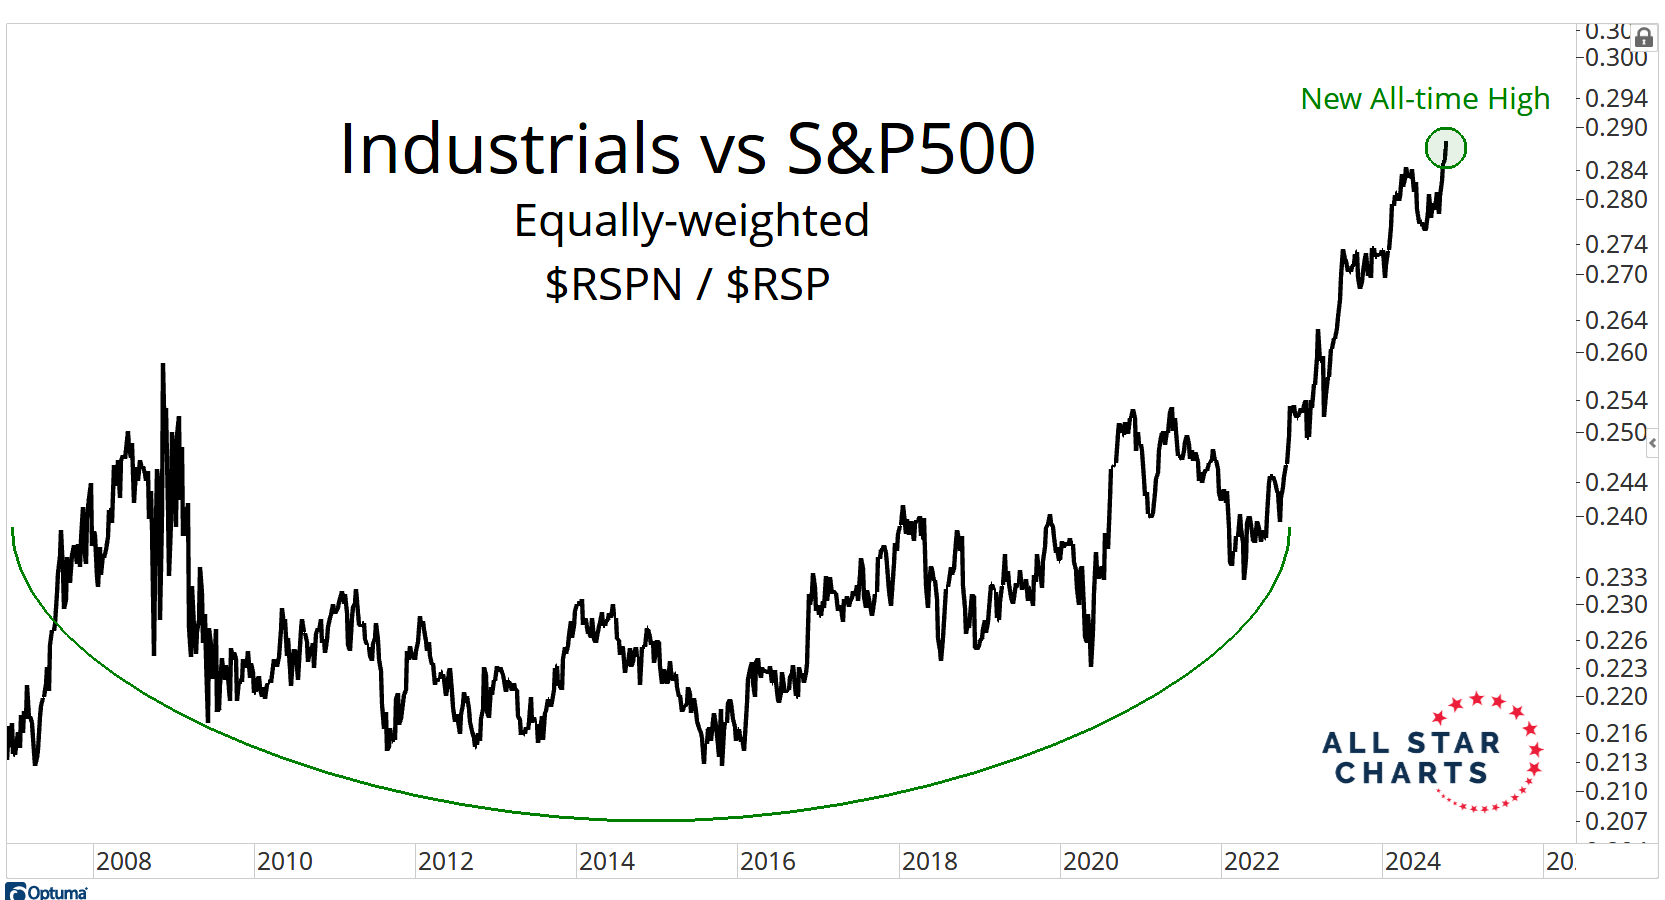
The Industrials Sector Index is already very diversified. No single stock represents more than 4% of this entire index.
You have all kinds of industry groups that make up this "category".
But taking it one step further, here is a chart of the equally-weighted Industrials relative to the equally-weighted S&P500, hitting new all-time highs:
So as it turns out, if we want to get a good idea of the next direction of the Dow Jones Transportation Average, then we should probably look at its "parent" index which is the S&P Industrials.
I realize it can be confusing, so I hope this helps.
Feel free to look up all the components of the DJ Transports and also the names inside the S&P Industrials Index, so you can get a better idea of which stocks are driving these index returns.
They're both up there in terms of America's most important indexes, and arguably the world.
So let's review:
1) We know it's not a bear market, because these are not the types of things that happen in bear markets.
2) We know that the most offensive sectors are leading the way - including Financials, Industrials, Technology and Consumer Discretionary.
3) We know that the most defensive sectors continue to be the laggards - including Consumer Staples and the Low Volatility Factor resuming their relative downtrends.
4) In bull markets, investors are rewarded for owning stocks. Investors who don't own enough stocks, or are god forbid short, are regularly penalized for their poor decisions. That's been happening for a while.
5) Most importantly, investors need to make the most amount of money possible during the good times. Because it won't always be like this.
The bull market is going on NOW.
Hypothetically, if the bull market were to end tomorrow, this will go down as one of the shorter bull markets in history, in terms of duration, and also very below average returns compared to all the others.
So there is little precedent for this bull market to end right now. And plenty of evidence that in many cases, it's just started to get going.
Many groups like the Dow Transports and the Small-cap Indexes, for example, still haven't even broken out above their prior cycle's peaks.
Consumer Discretionary still hasn't even taken out those former highs.
This could potentially just be getting started, especially with market sentiment still down in the dumps and a volatility index above 20!
You want to talk about a tailwind?
And we're also heading into the most bullish 3 month period of the entire year - November through January.
So what do we buy?
How do we take full advantage of the opportunity that's in front of us?
That's where ASC Research comes in. We put out trade ideas throughout the week based on extensive top/down analysis.
But because our audience is looking to maximize their returns when it's the time to maximize returns - the team got together with our developers and built the ultimate 3 step system called Breakout Multiplier.
This system is very specifically designed to profit to the fullest extent possible when a new trade is presented - multiplying the returns of a breakout.
The idea here is to turn a normal 15-20% trade into 300% - 500% returns or more.
We've seen 10x returns and even more than that since making the Breakout Multiplier system public.
We are not messing around.
This is a bull market and it's up to us to capitalize on this opportunity as much as we can.