Gold is printing new all-time highs. Copper is trading above four bucks. And Palladium…
Well, Palladium has stopped going down.
Considering Palladium’s Commitment of Traders (COT) profile, its tendency to trend with technology stocks, and where it stopped falling…
It’s time to buy!
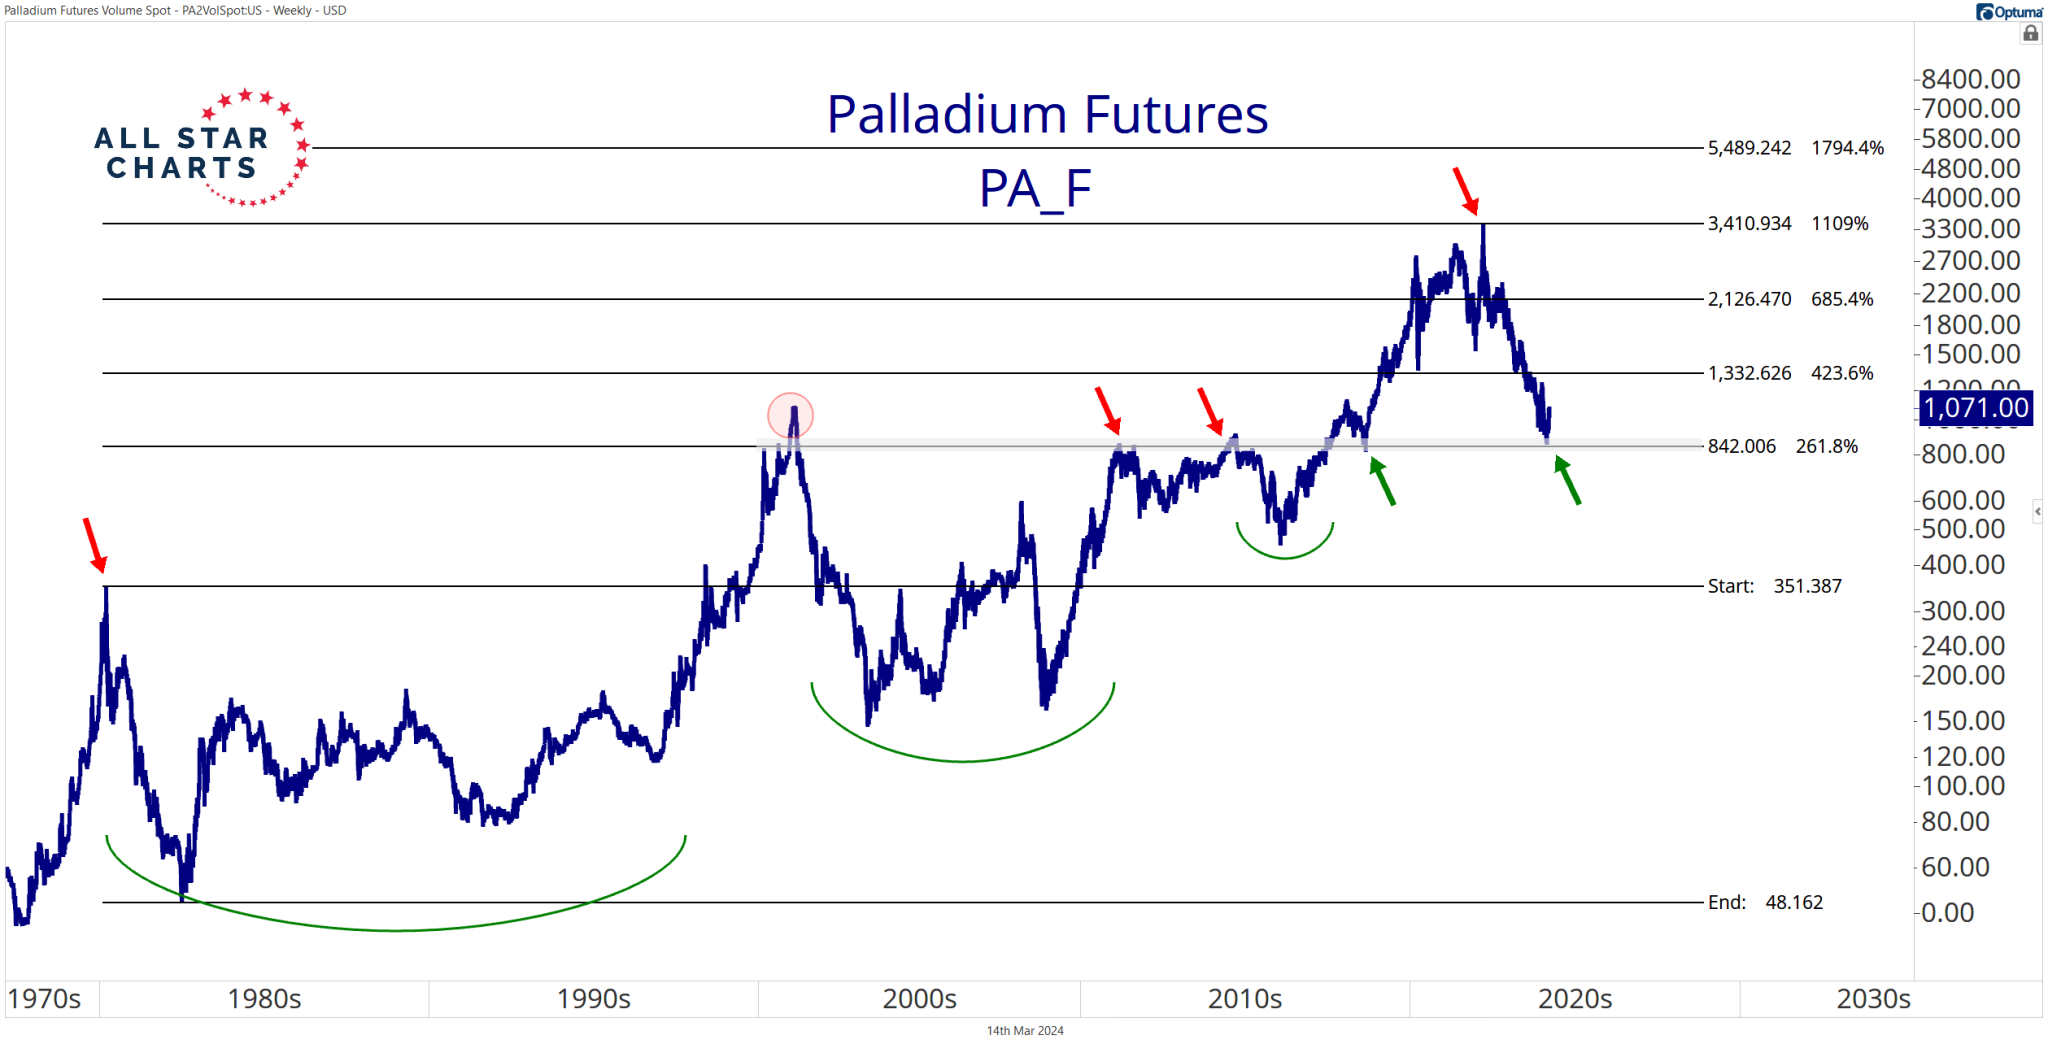
Check out the long-term Palladium chart stretching back to the late 70s:
Palladium is bouncing off a critical extension level based on the early 1980s decline — a level that acted as resistance for almost two decades.
The principle of polarity is springing into action, just as it did in 2018 when buyers stepped in and defended those former highs.
Approximately 850 marks this critical area of former resistance turned support and a logical level to trade against.
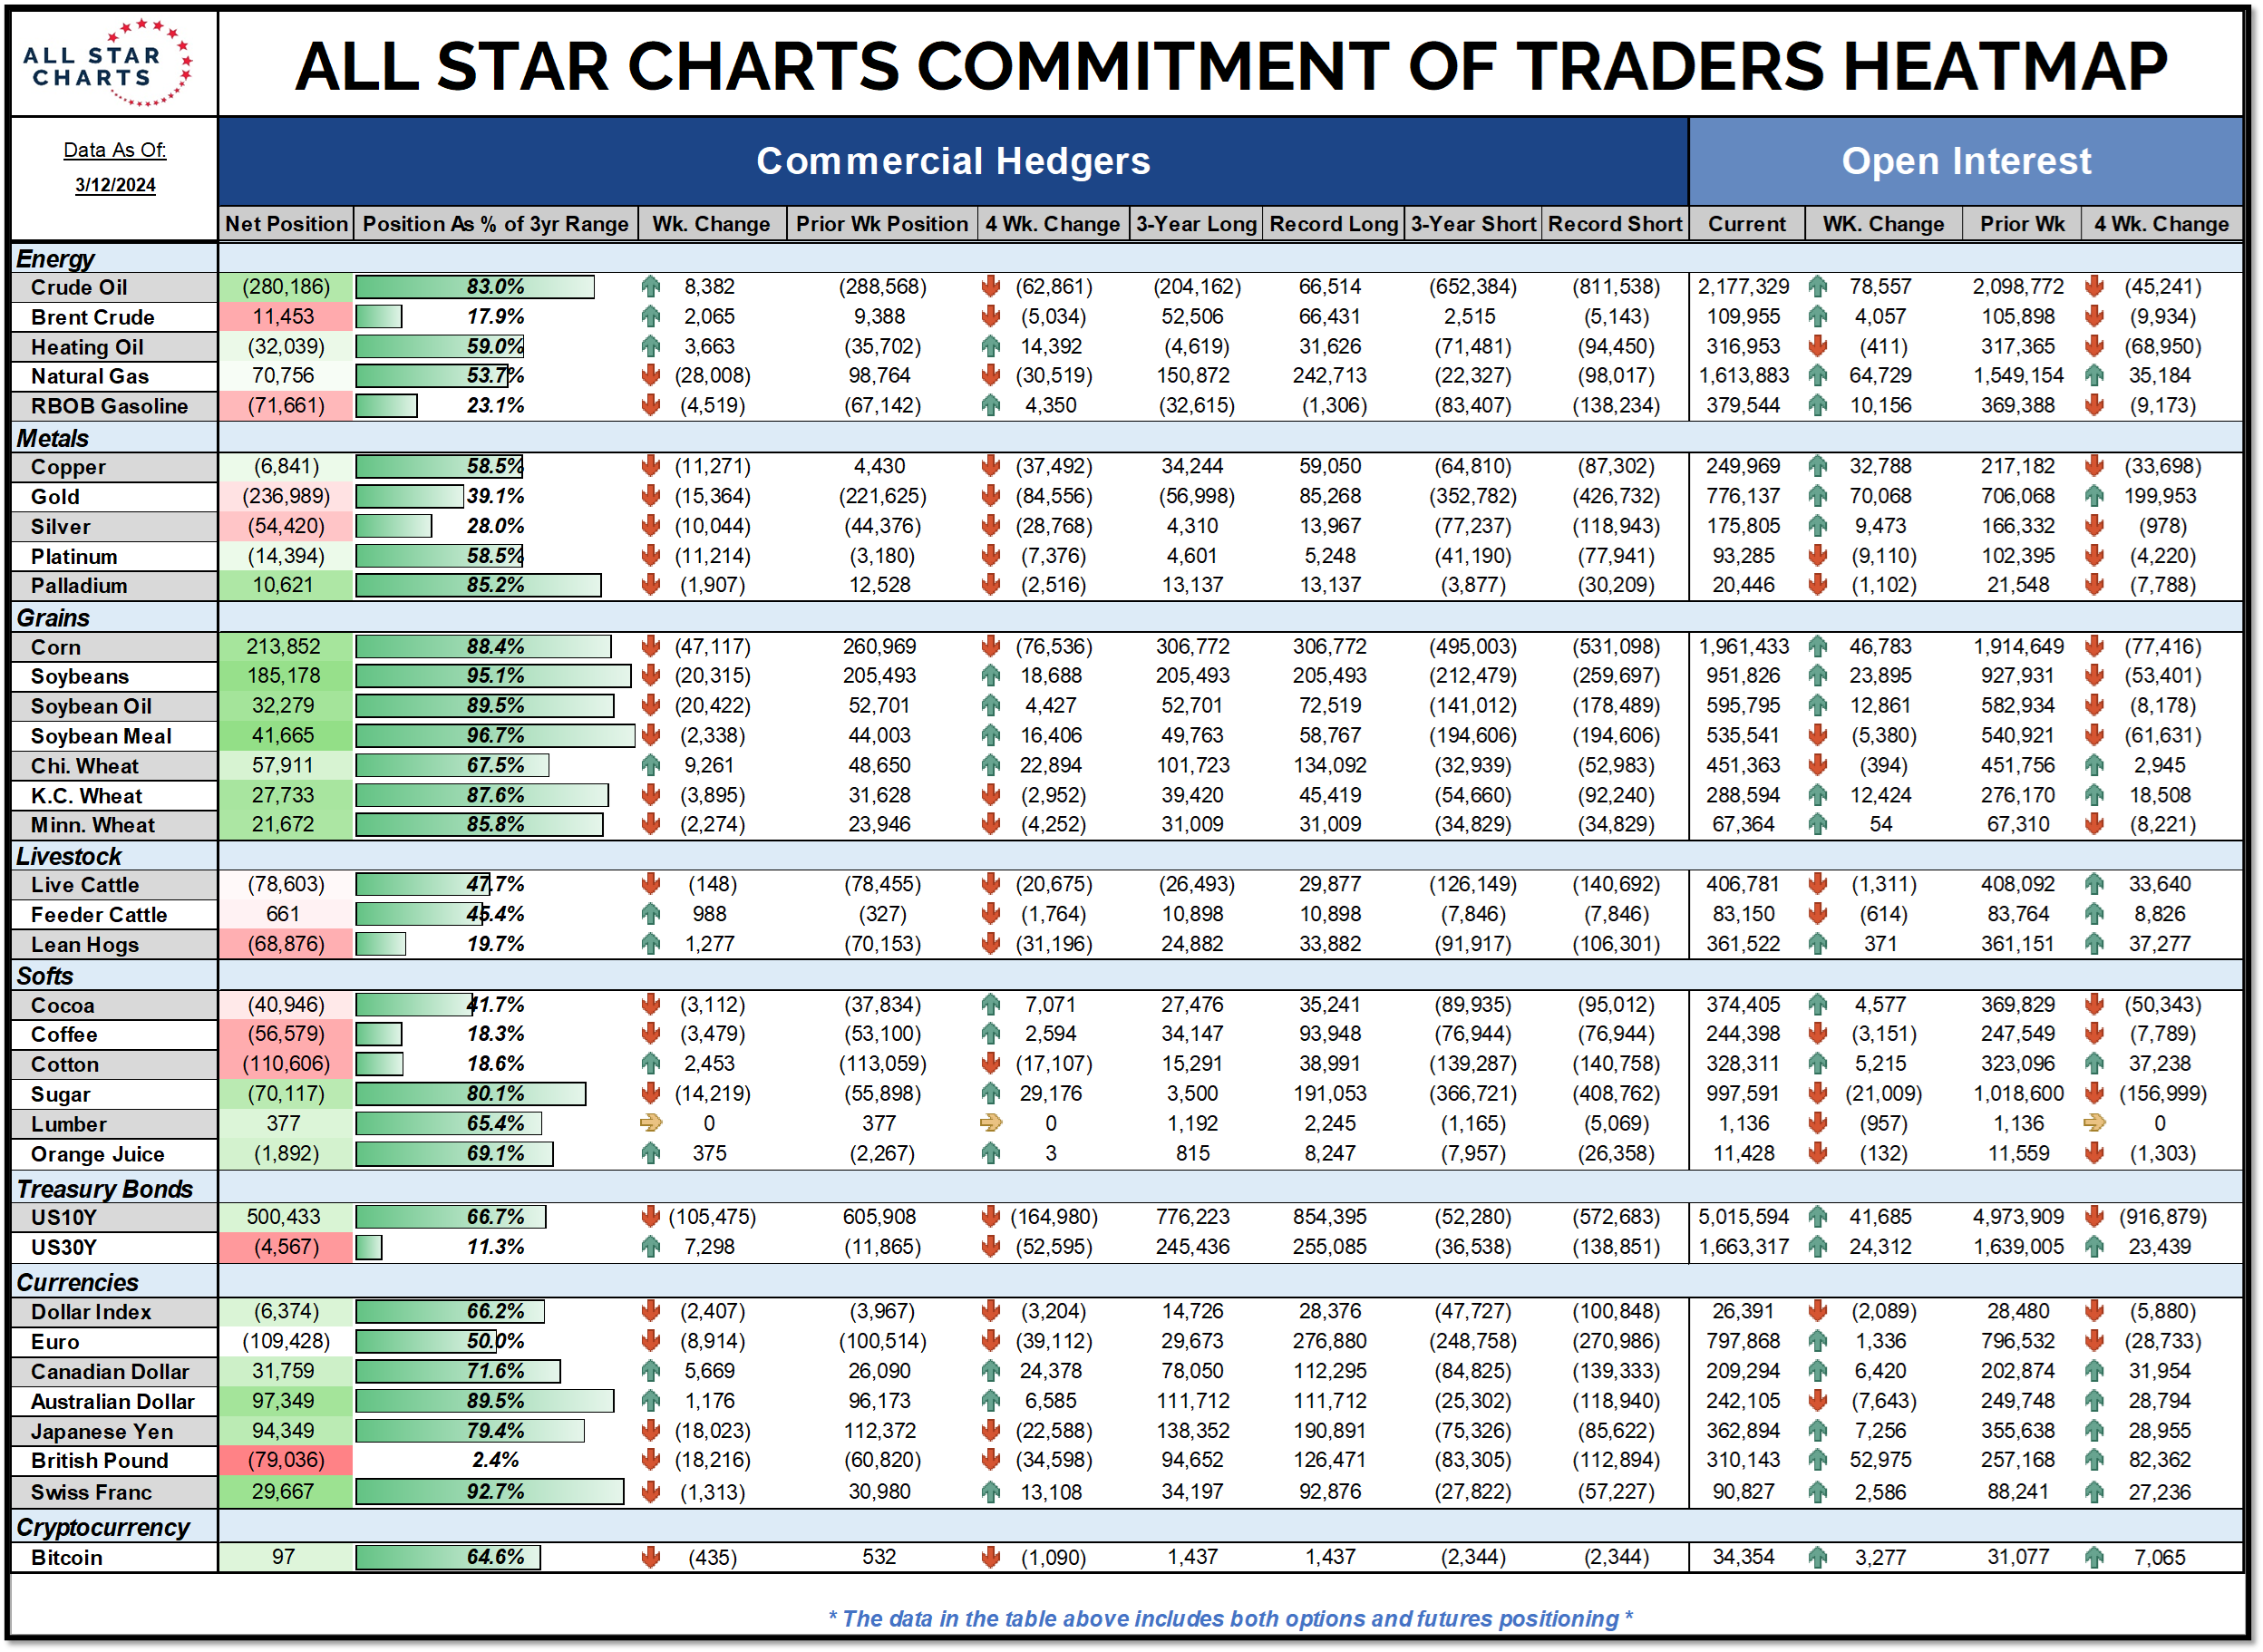
Add commercial hedgers’ record-long position, and Palladium could catapult higher in the coming quarters.
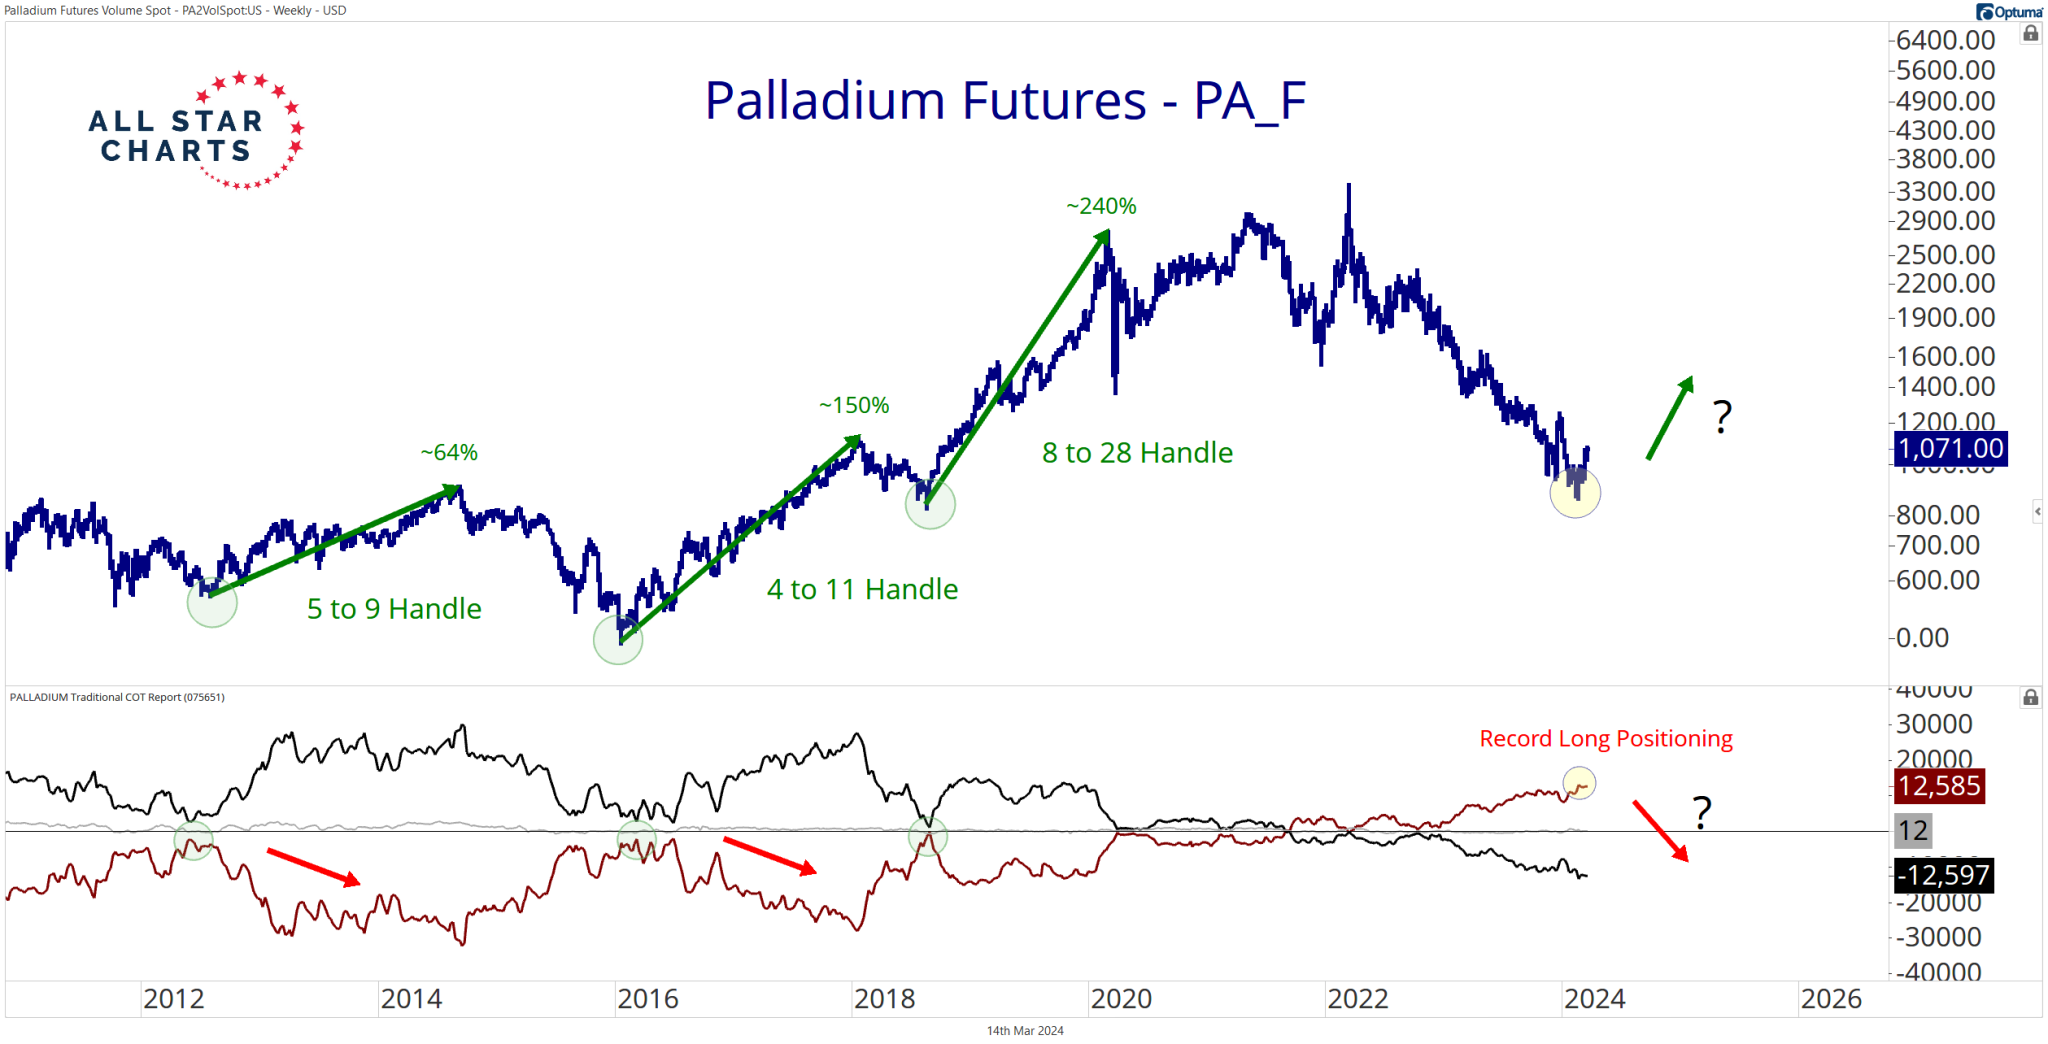
Strong hands move markets, mainly the hands of Commercial hedgers. Commercials are the “smart money” with the deepest pockets.
Historically, they have held a net-short position, rarely crossing into net-long territory. However, Commercials have flipped the script in recent years, carrying a net-long position since the fall of 2021.
Meanwhile, their palladium exposure has grown steadily – one record-long position after another.
To be clear, COT positioning provides insight into market conditions — not a direct buy or sell signal. Price always dictates how we enter and exit any given market.
Nevertheless, extreme positioning sets the stage for an epic unwind that will fuel a rip-roaring rally, not unlike the uptrends beginning in 2012, 2016, and 2018.
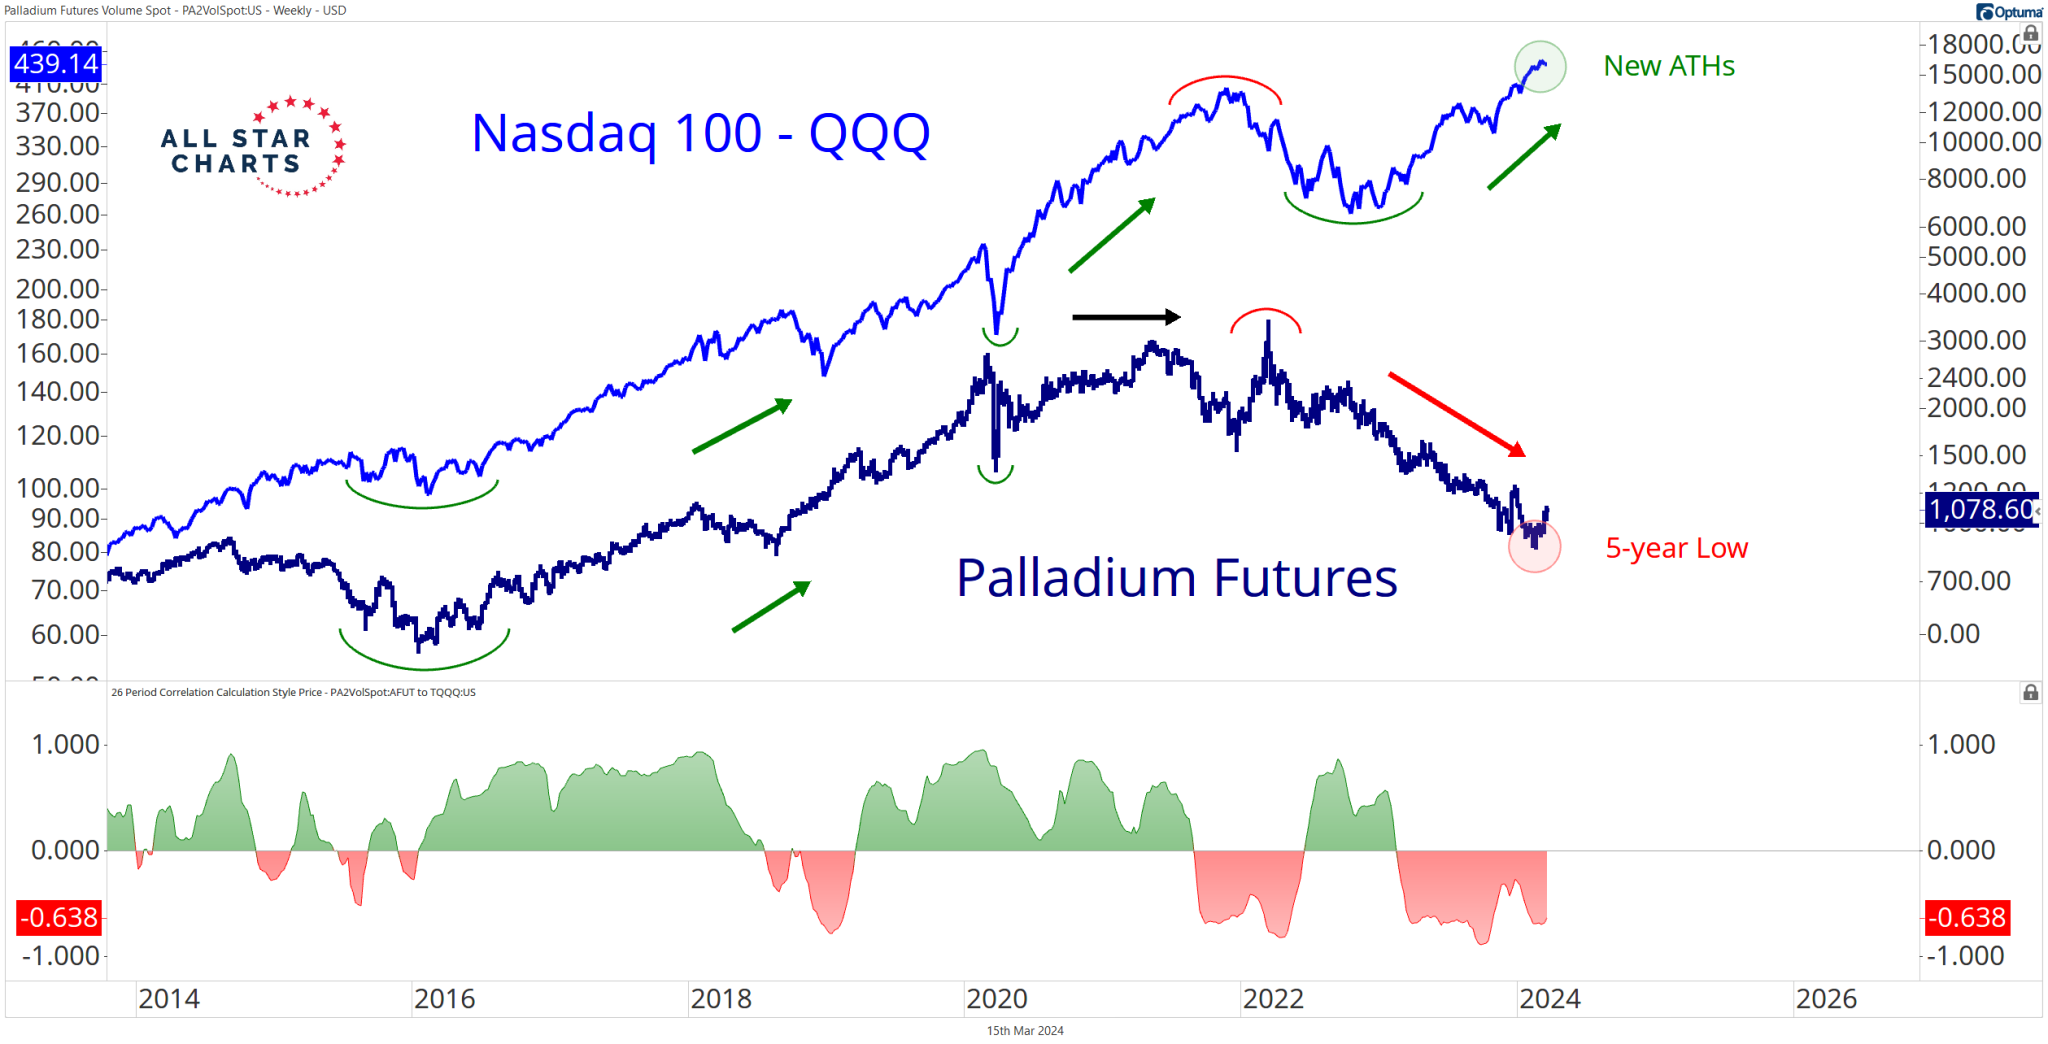
Plus, palladium futures have posted a drastic divergence from technology stocks over the trailing twelve months:
Interestingly, palladium futures and the Nasdaq 100 $QQQ tend to possess a positive correlation (highlighted in the lower pane with a rolling 26-week correlation study).
The relationship never crossed my mind until I stumbled upon these Bartelloni charts in an ASC post from 2011! (I highly recommend scrolling through the ASC catalog.)
Fast forward to today, and I see two markets at extremes: the Nasdaq 100 posting all-time highs and palladium futures bouncing off fresh five-year lows.
Will Palladium catch up to tech stocks?
Or, will tech catch down to Palladium?
I don’t know. But I highly doubt the QQQ and Palladium catch lower in the coming months.
At the very least, I expect the two will meet somewhere in the middle.
Whichever way you slice it, you get a bullish scenario for Palladium.
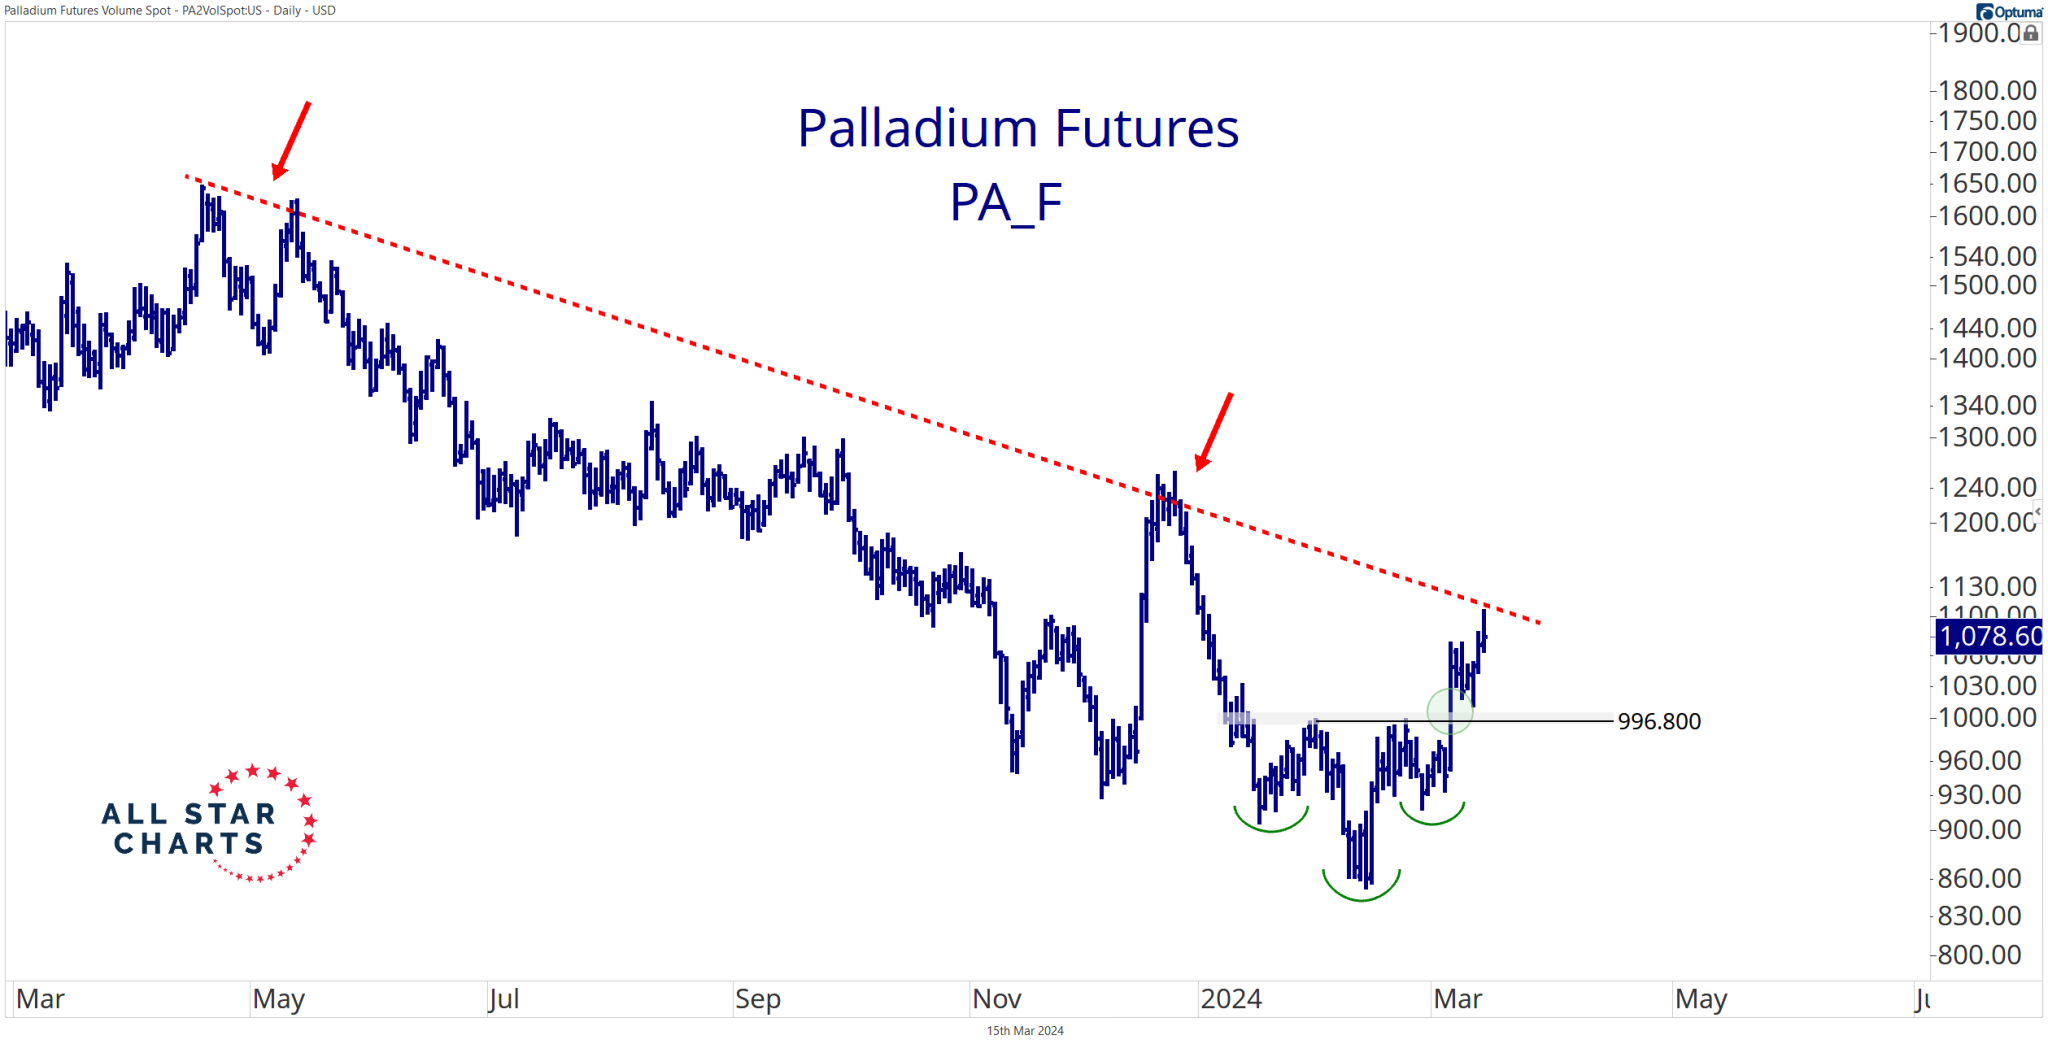
Here’s how I would play it…
I prefer to define risk at 996 over the 850 level mentioned earlier.
The 996 level marks the neckline of an inverted head-and-shoulders pattern. As long as price holds above that breakout level, our initial target stands at 1,325.
Beware: Palladium futures remain in a steep downtrend.
I don’t want to give this trade too much room, as a more prolonged bottoming process could lead to opportunity costs.
For all the traders out there who don’t have the account size for a responsible palladium position or don’t trade futures, the ABRDN Physical Palladium Shares ETF $PALL is your ride!
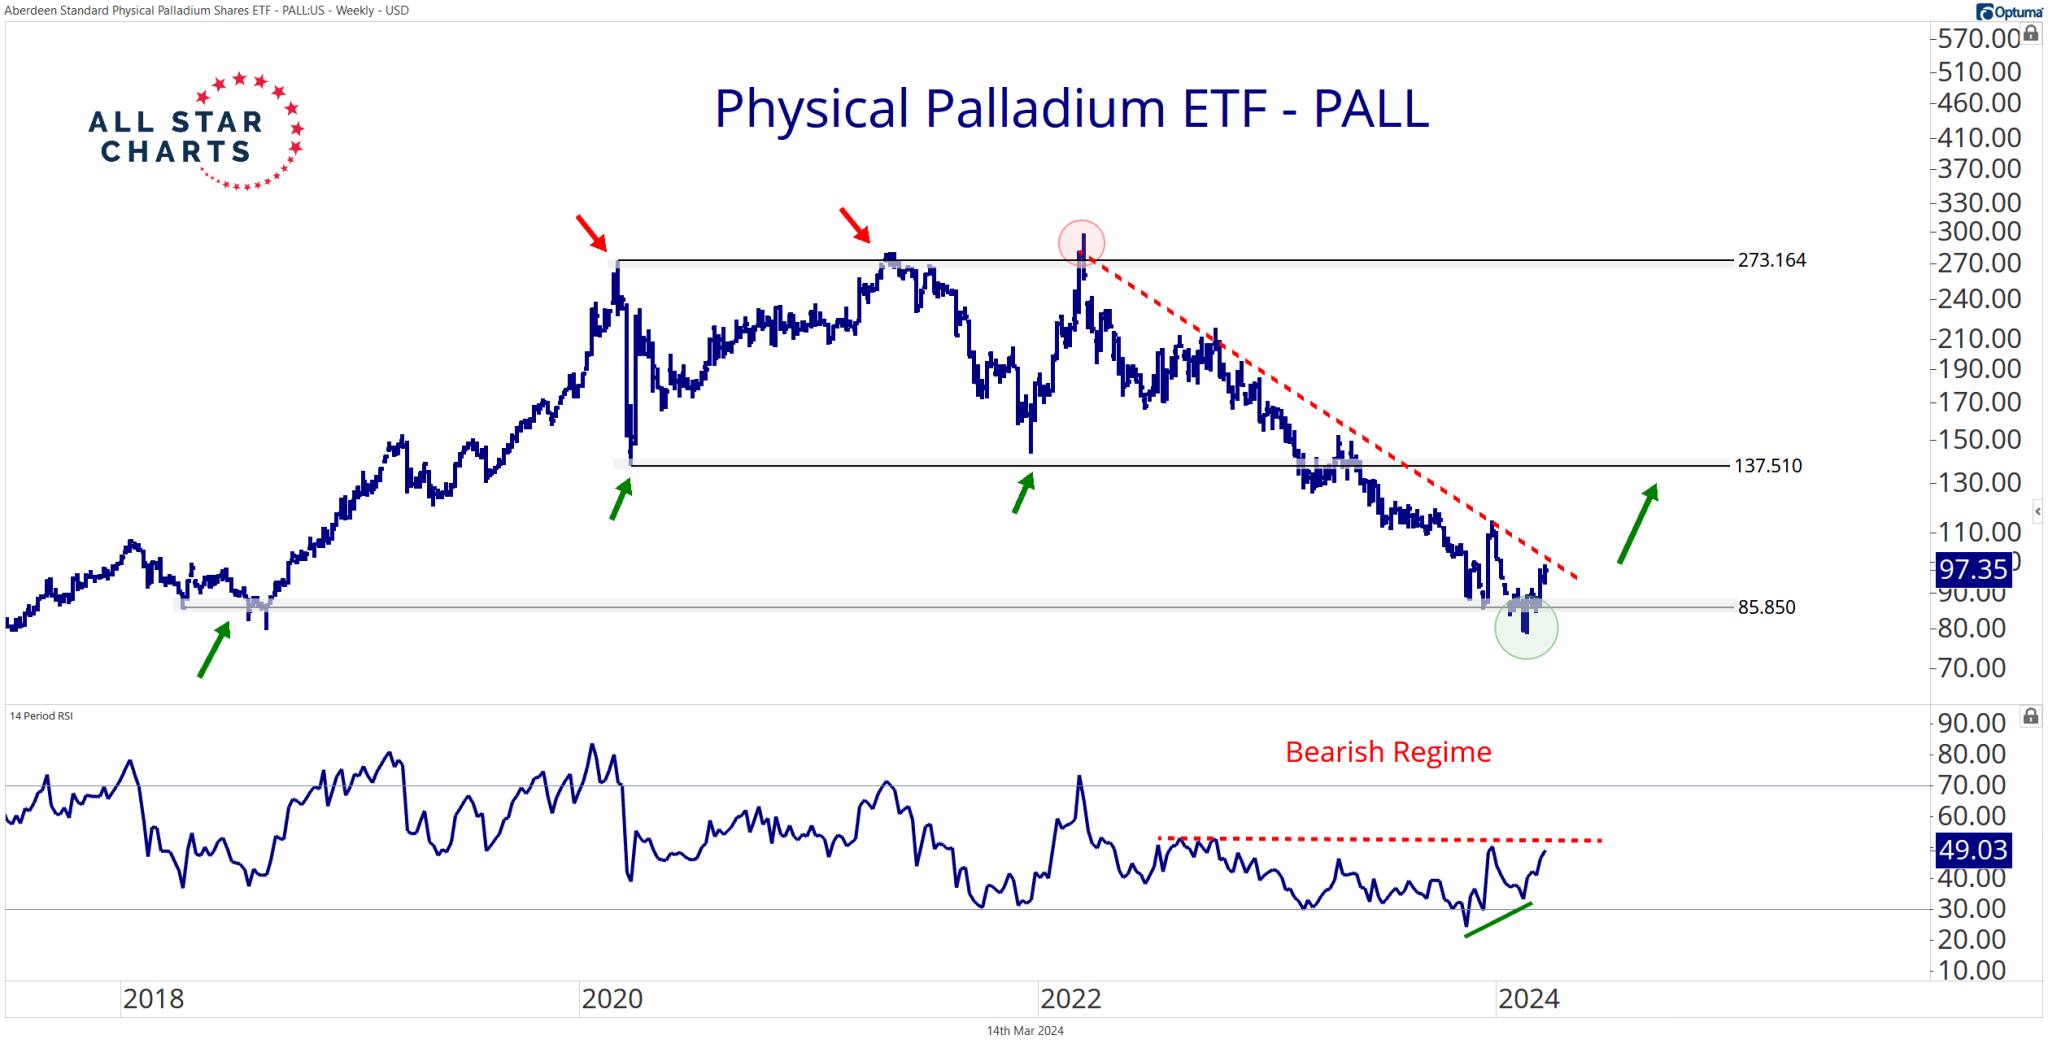
I’ve highlighted PALL’s 86 level countless times in the weekly Gold Rush videos. That’s our line in the sand:
I like owning PALL with an initial target of 137 and a secondary objective of approximately 275 as long as it trades above our risk level.
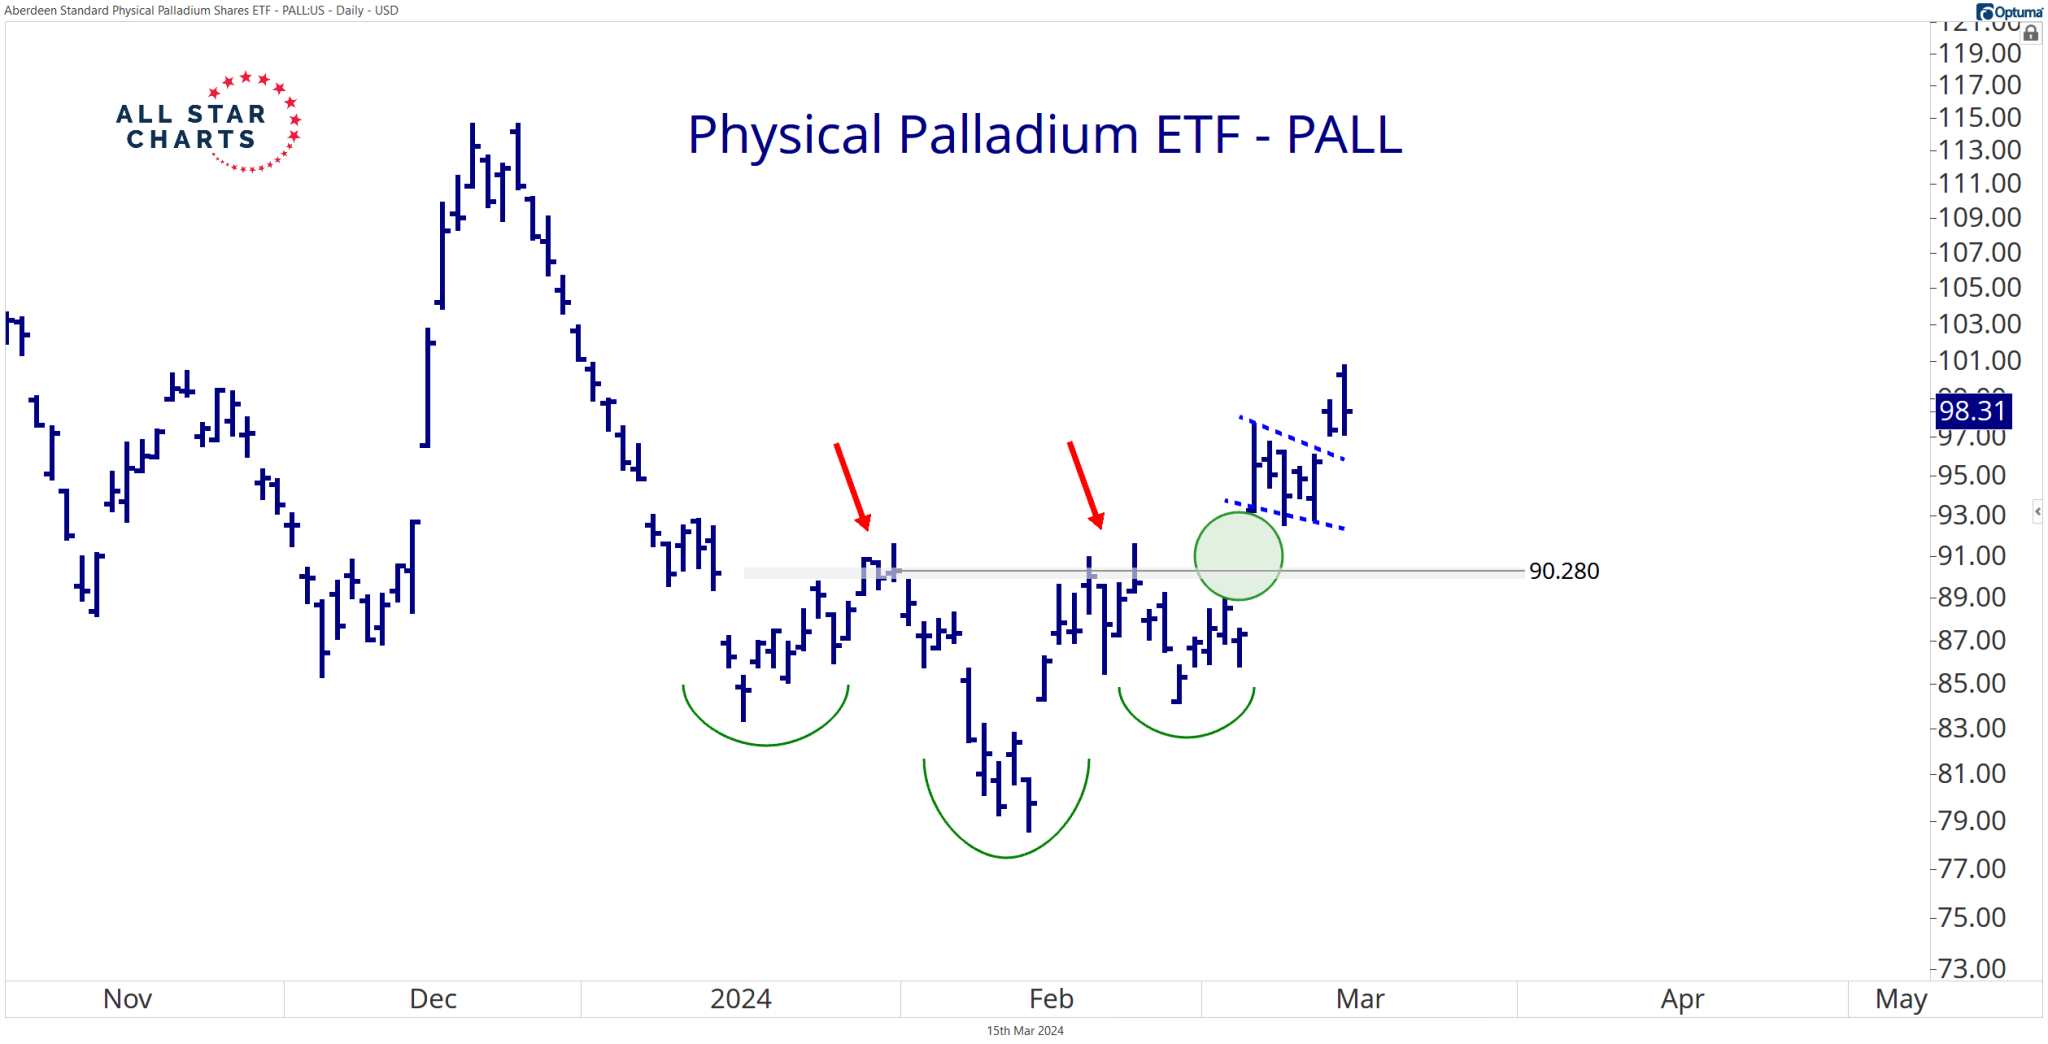
If you choose to move your protective stop to just below 90 (corresponding with last week’s inverted head and shoulders breakout) — that makes sense, too:
Gold kicked off the next leg higher for metals. Copper futures broke out earlier this week. And Palladium is poised to join the fun.
I wouldn’t be surprised if this eight-week inverted head and shoulders pattern ticked a generational low in Palladium.
Of course, I could be wrong. But that’s why we trade against well-defined levels and manage risk.
Gold Rush Report highlights the breakout setups, rotations, and technical signals shaping metals markets — giving traders an edge in gold, silver, and commodities.


