
How to Trade Energy’s Seasonal Tailwind

February 9, 2024

From the Desk of Ian Culley @IanCulley

It’s time to turn our attention to the energy space.

The same market conditions that favored energy in Q3 of last year are brewing. 

Interest rates are rising. King Dollar is refusing to step aside.

And energy contracts – especially crude oil – are entering a historically strong period of the year.

Check out crude oil’s seasonality since 1984: 

February kicks off the strongest four-month period of the year.

Meanwhile, energy contracts are forming potential bullish reversals.

Perhaps last month’s crude oil breakout has been sloppy. But buyers reclaimed our risk level yesterday – right around when crude tends to bottom. 

Here’s crude’s seasonality for the next two months (February through March):

Up and to the right! 

Seasonality paints a bullish picture for oil and this chart doesn’t include April – black gold’s strongest month of the year.

Of course, seasonals alone aren’t a reason to take a position.

Instead, they reveal an aspect of the market environment, like positioning and sentiment.

Regardless of how one weighs the evidence, bullish data points shift to energy’s corner. And I plan on following a rotation into oil and gas stocks. 

Here’s Weatherford Intl. $WFRD, a $7B oil services name:

Last October, we outlined a bullish setup in WFRD in our Commodity Trade of the Week.

The stock has consolidated within a tight range since, forming a four-month rectangle.

If and when WFRD closes above 100, I’m long targeting 152.

It’s a favorable environment for energy. 

Rates continue to rise, and the US dollar reigns supreme.

Plus, seasonal strength adds to a bullish bias for crude oil and its distillates.

If these trends continue, those often overlooked oil and gas names will provide profits while most stocks fall under selling pressure.

Stay tuned.

COT Heatmap Highlights

  • Commercial hedgers post another record-long position in corn.
  • Commercials add more than 15,000 contracts to their long soybean position, falling within 5,000 contracts of the record.   
  • Commercial hedgers pull within three percent of their smallest net-short position for crude oil in three years. 

Click here to download the All Star Charts COT Heatmap.

Trades of the Week

First up is Valero Energy $VLO, a $48B refiner:

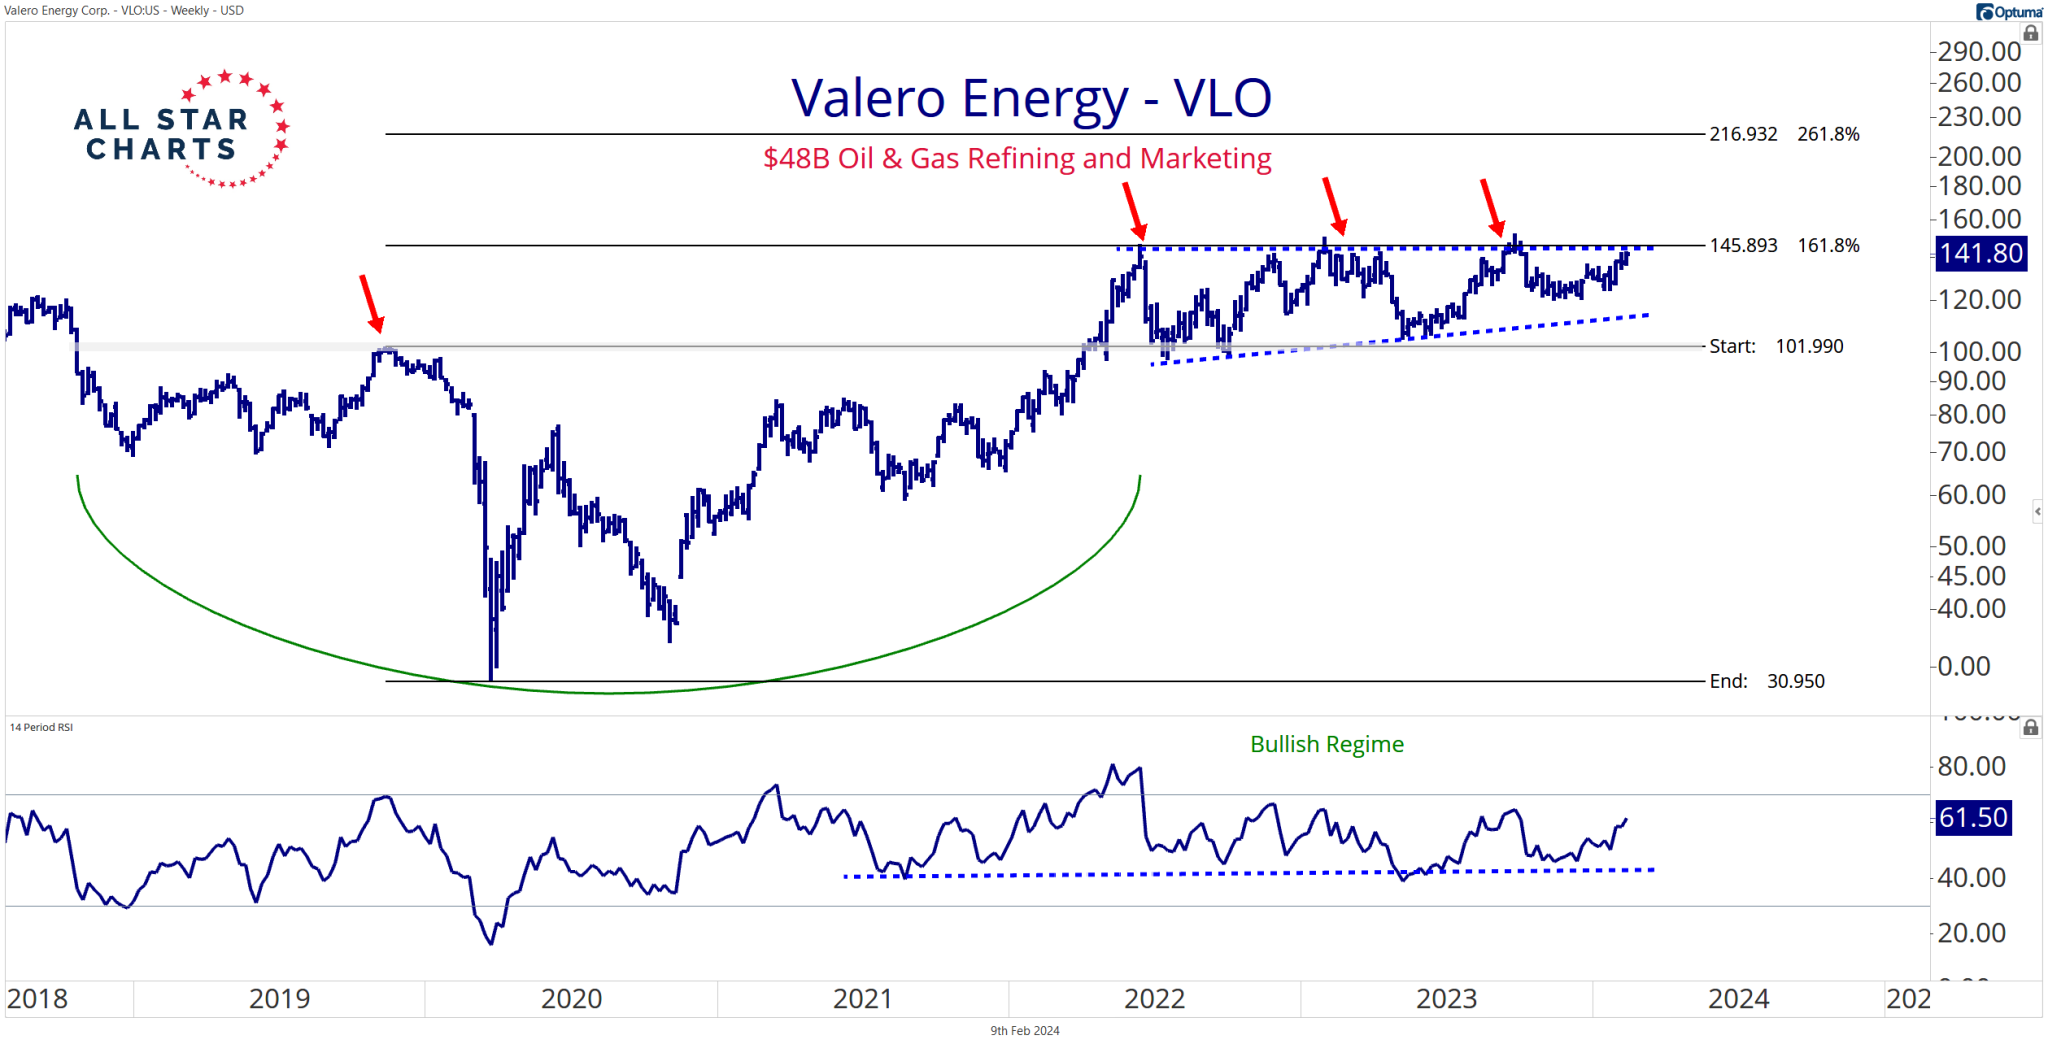
VLO was a Trade of the Week in May 2022 (the first red arrow at the 145 level).

Our buy signal was never triggered, as the stock found an overwhelming supply at our risk level. 

Since then, it has carved out a 20-month ascending triangle. I like buying VLO on an upside resolution above 146, targeting 215.

Valero remains off-limits until a decisive breakout.

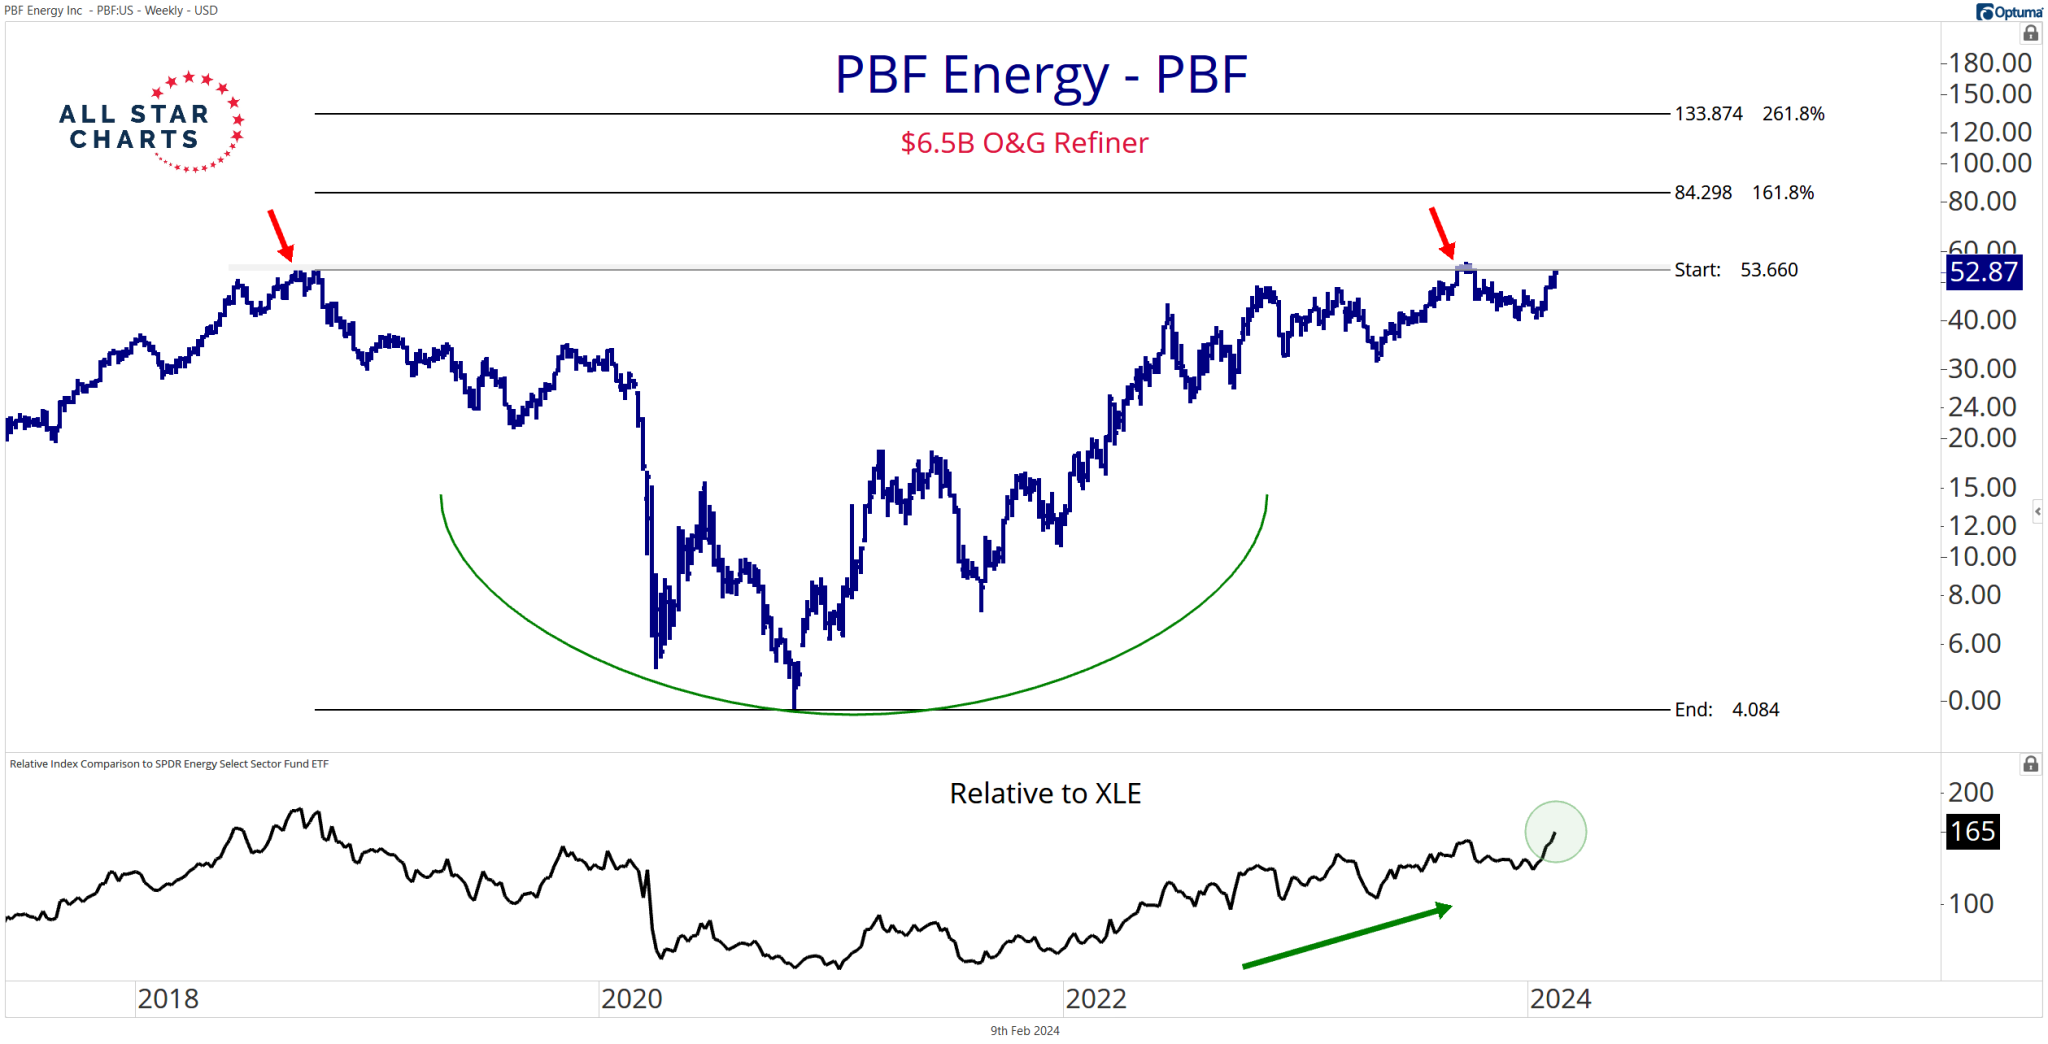
Here’s another oil and gas refiner, PBF Energy $PBF:

PBF popped up on our Follow the Flow scan last August.

Today, PBF Energy is challenging our risk level while posting new highs versus the broader market.

Since we’re trading a five-year basing formation, I want to give PBF a little room by buying strength above 55 with an initial target of 84 and a secondary objective of 133.

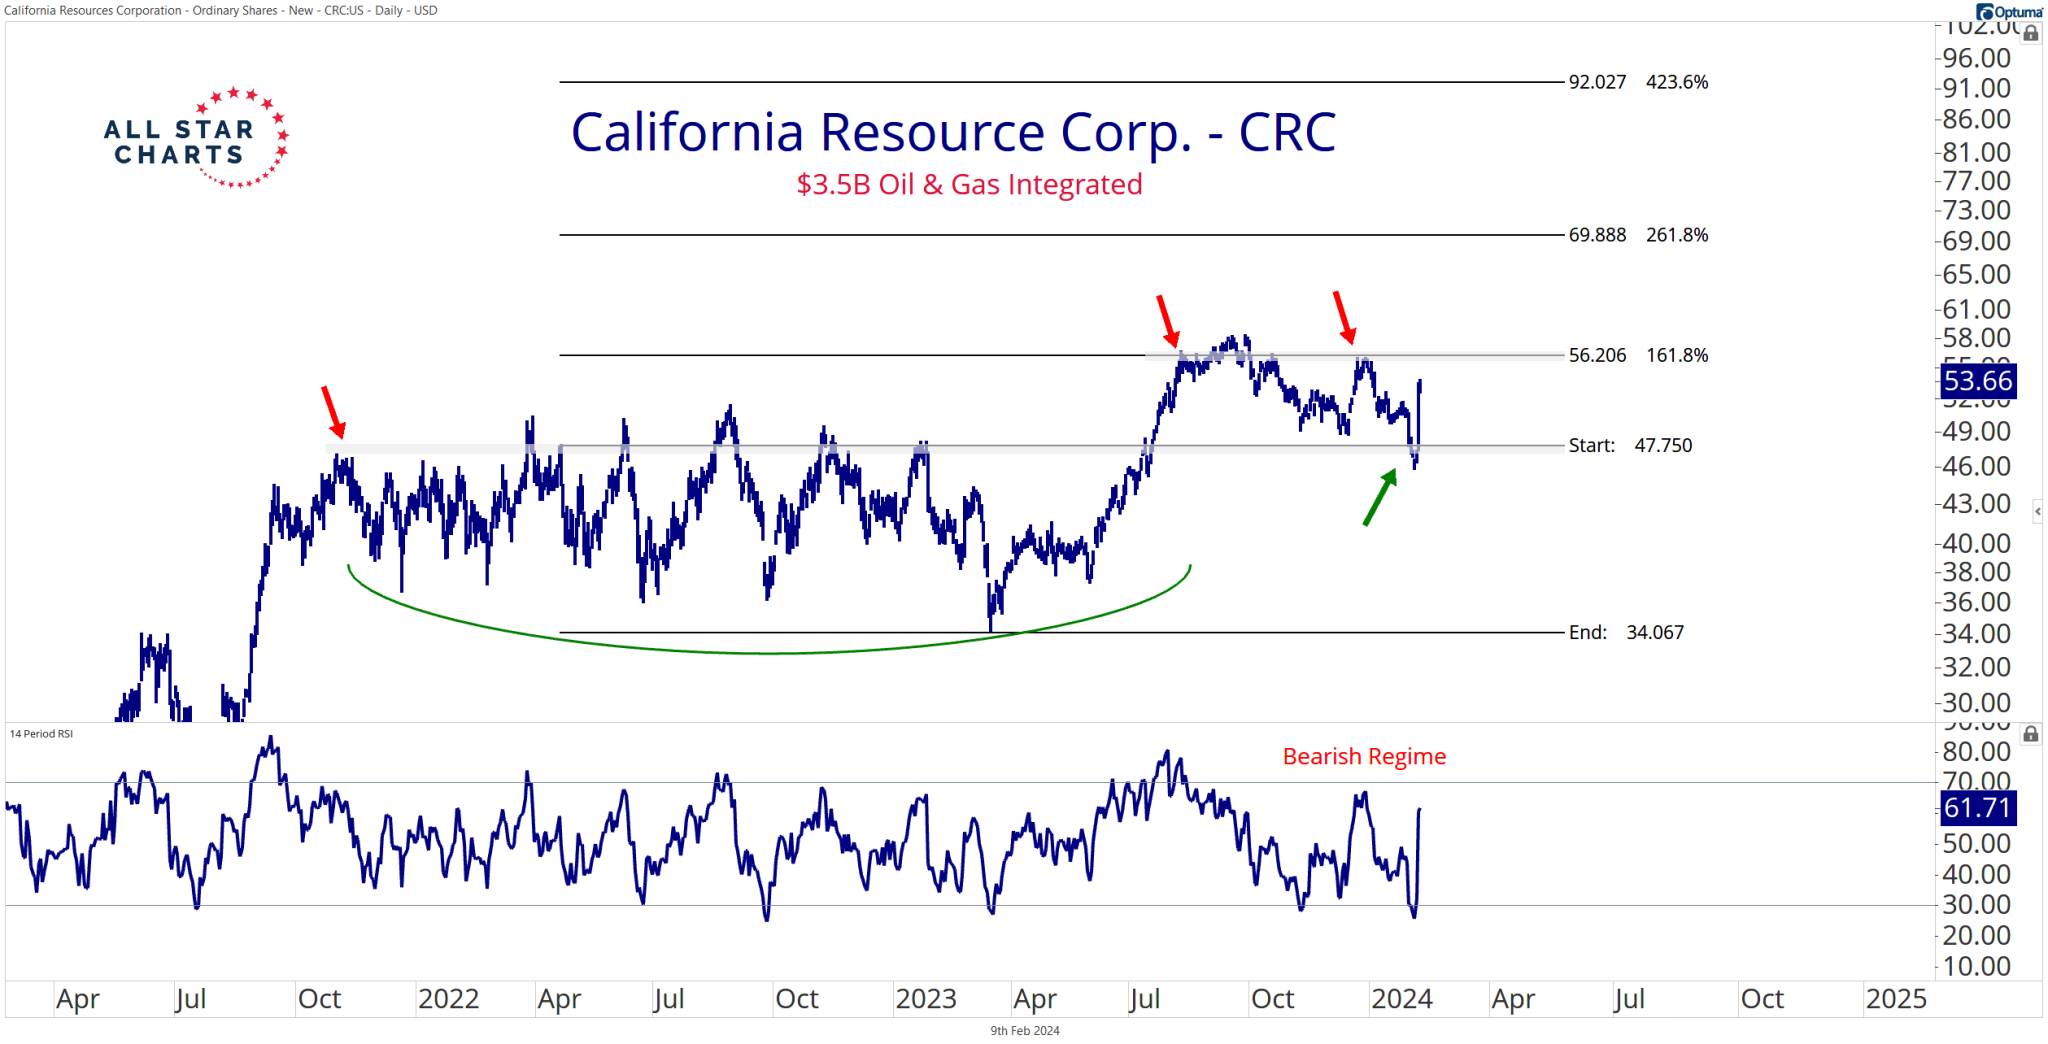
Next up is California Resources Corp. $CRC, a $3.5B integrated company:

CRC is bouncing off a shelf of former highs, ripping more than 13% last Wednesday.

I like buying a breakout above 56.25, targeting 70 and 92. But I won’t jump the gun, as CRC will likely consolidate before triggering a buy signal.

And now for something completely different…

The following two trades involve buying weakness toward former support.

While I always prefer buying strength, these setups provide precise levels to trade against, and the risk-to-reward ratio is heavily skewed in our favor.

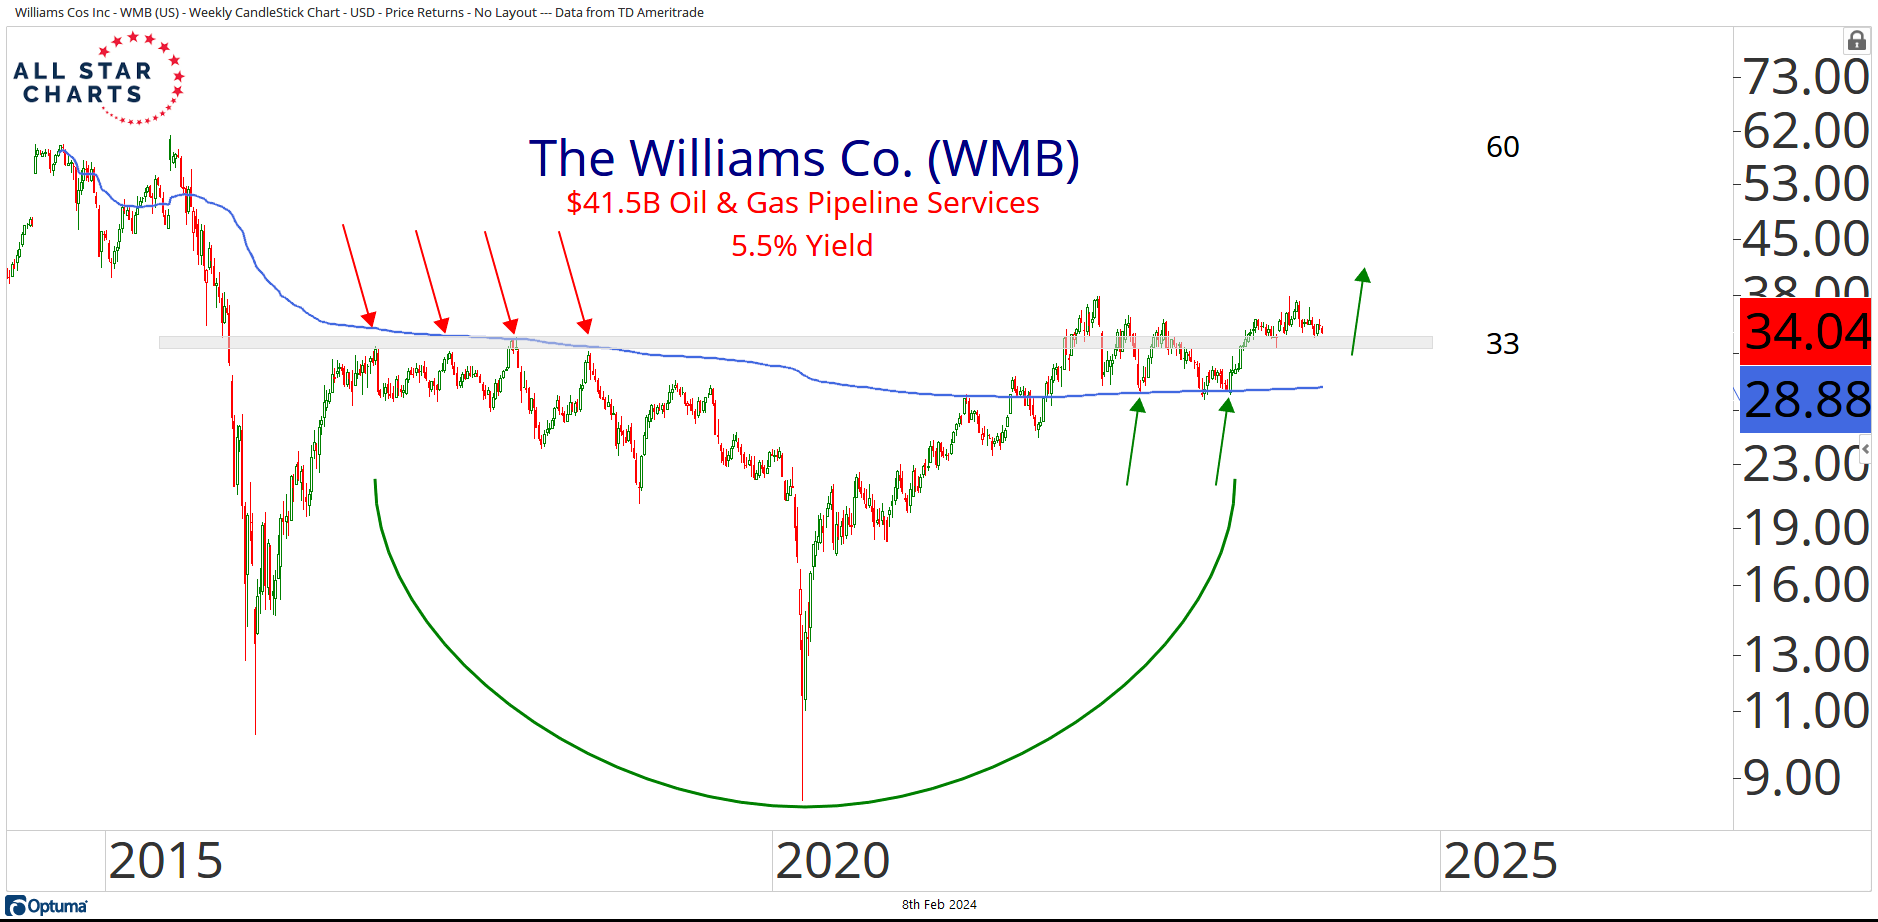
Here’s The Williams Co. $WMB, a $41.5B pipeline services company:

WMB also experienced unusual options activity last summer, captured by our Follow the Flow scan.

The idea was to get long above resistance at 33.50 with an initial target of 49.

Price has broken above our risk level and is now finding support at approximately 33.  

That’s the level to trade against, adding a secondary objective of 60.

You could also use the AVWAP anchored from the 2014 peak as a stop level (highlighted in blue).

Notice that the AVWAP acted as resistance from 2016 through 2019 and has now become support.

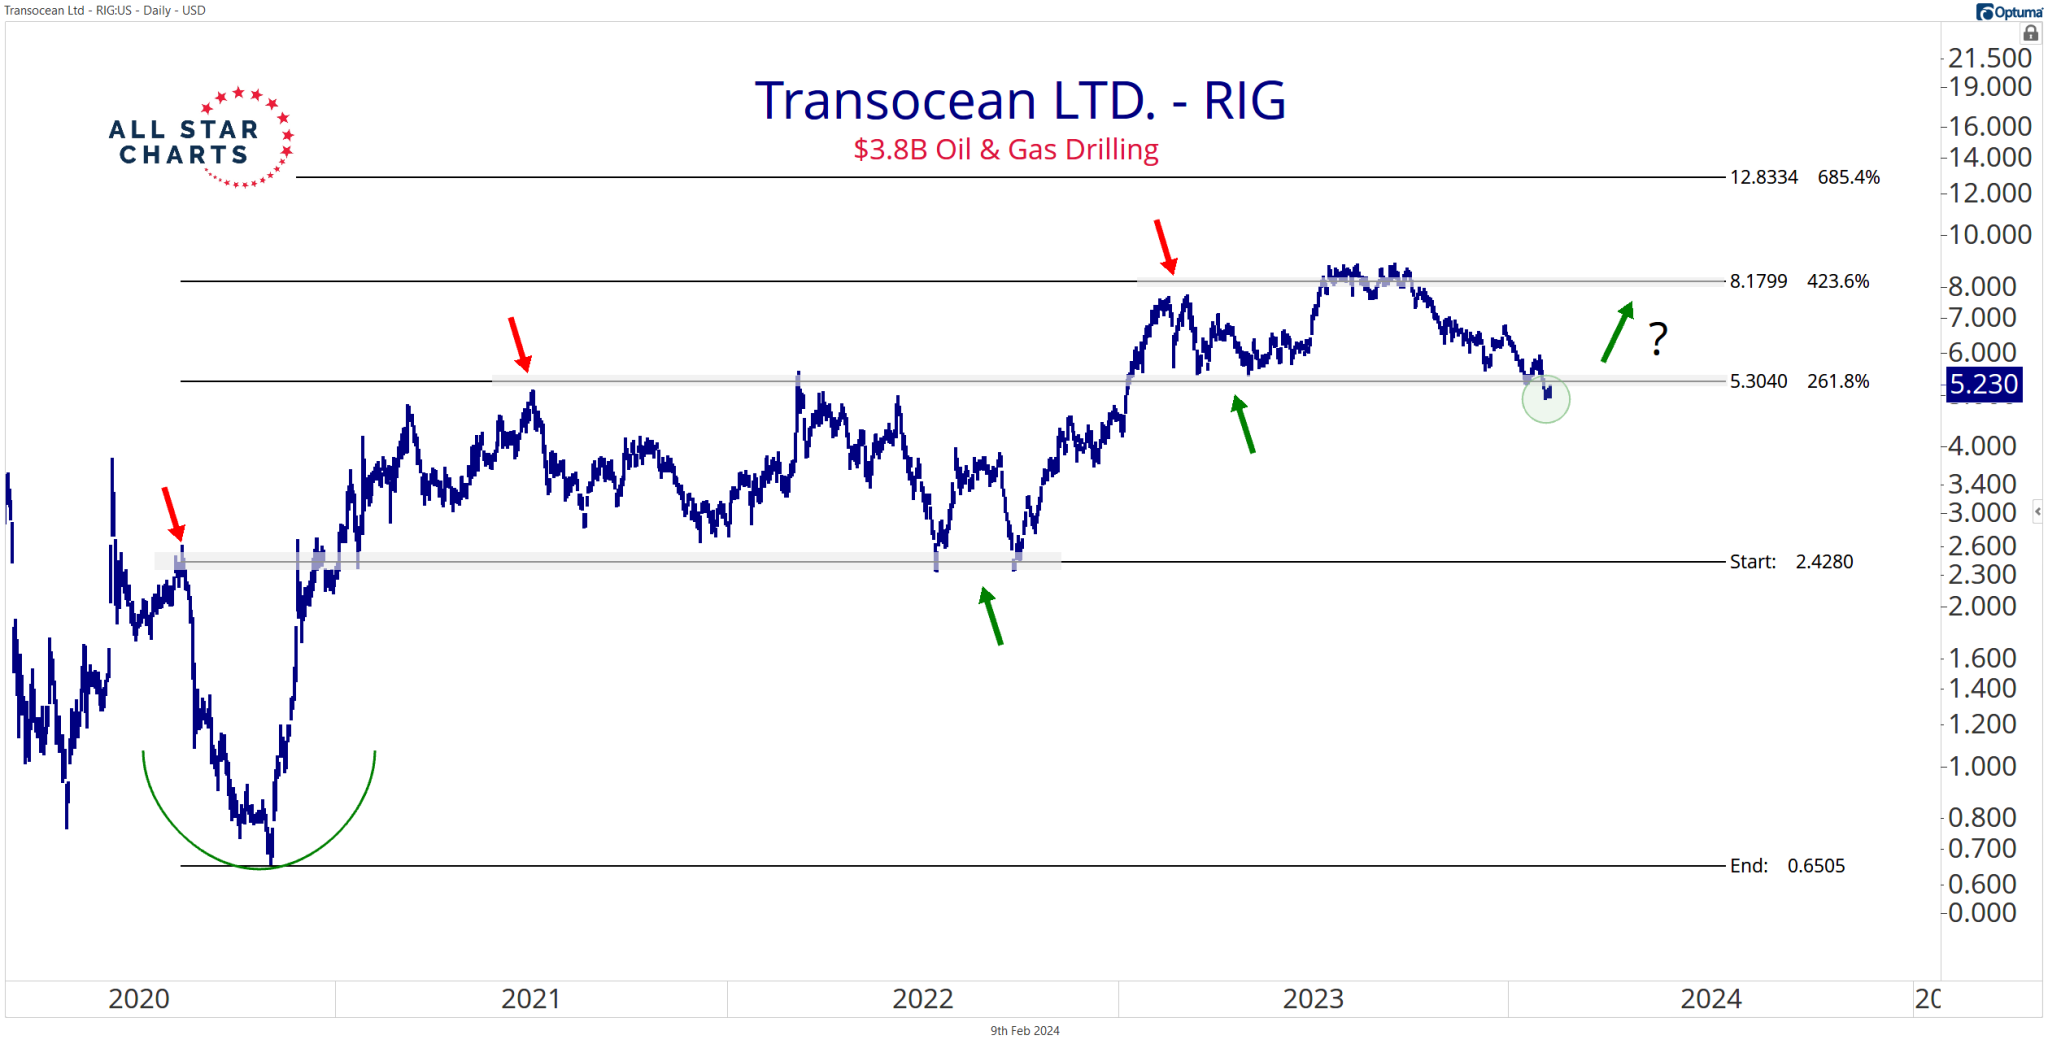
Transocean Ltd. $RIG rounds out today’s list:

RIG belongs to the drilling industry, a group of stocks known for their volatility.

The stock’s high beta nature adds to my conviction of a bullish bet on a failed breakdown.

If the broader energy space is working its way higher, RIG is likely springing a bear trap.

RIG flashes a buy signal on a daily close above 5.50, with an initial target of 8.00 and a secondary objective of 12.75.

That’s it for today.

Thanks for reading.

And be sure to download this week’s Commodity Report below!

Click here to download the Commodity Report Chartbook.

Allstarcharts Team

Filed Under