Silver futures have undercut a critical shelf of former lows.
I find it difficult to hold a bullish bias for precious metals and mining stocks, at least from a tactical perspective.
And when I zoom out to longer time frames, overhead supply looms large across the entire space.
Understand, I believe precious metals and their related stocks ultimately resolve higher, printing fresh all-time highs.
But before we can put money behind this bullish thesis, these next three charts need to throw it in reverse…
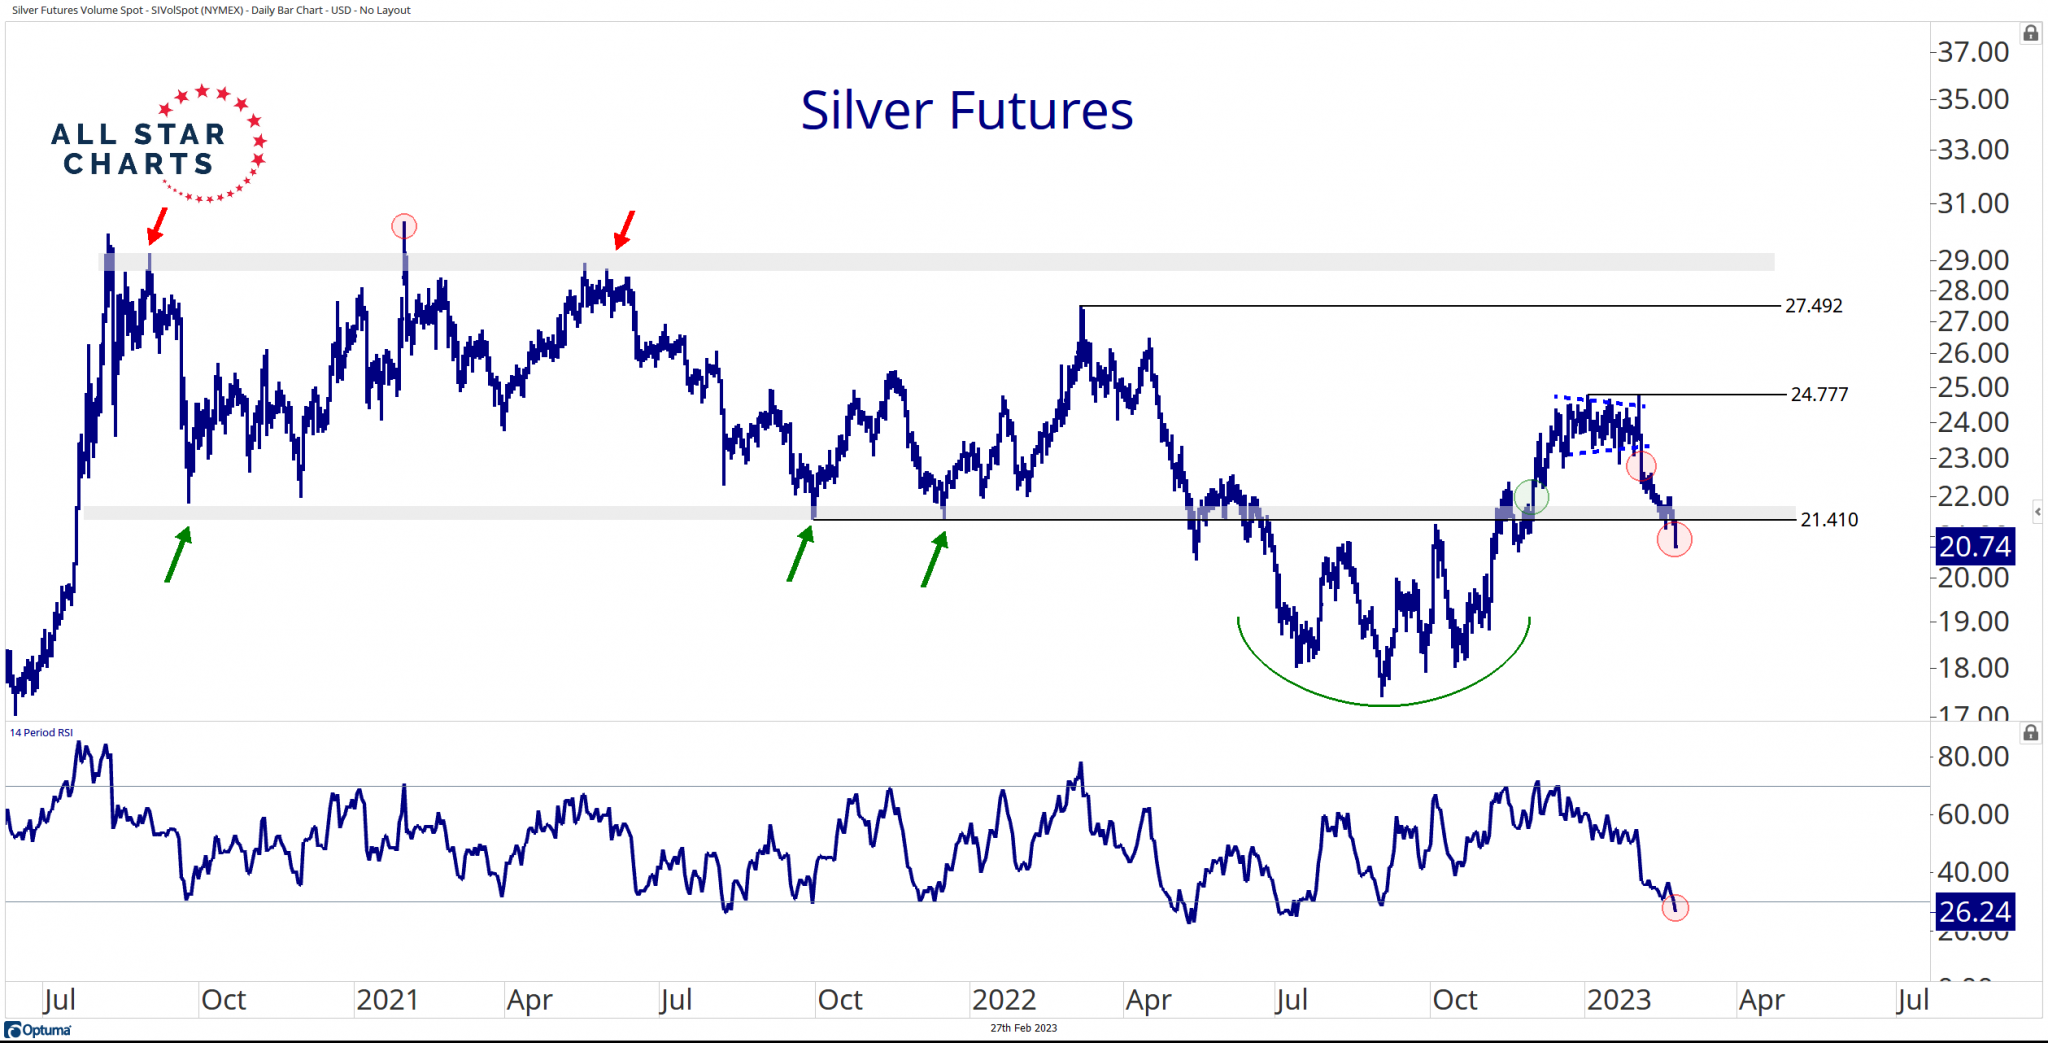
First, here’s the daily chart of silver:
Nothing bullish is happening for precious metals, while silver slides below multi-year support.
Last Friday’s breakdown and oversold momentum reading represent red flags.
Precious metals demand caution as long as silver holds below 21.40.
Why?
For starters, a breakdown in silver indicates dwindling demand.
We want to witness the entire space participate. Gold’s not going to post new all-time highs all on its lonesome.
Broad participation from silver, platinum, and mining stocks is key.
Silver breaking down out of a two-year consolidation doesn’t scream bullish.
Actually, it’s quite the opposite.
The weakness in silver also speaks to a lack of risk-seeking behavior.
Silver is fondly called “gold’s crazy cousin” because it’s the higher-beta play. And precious metal bulls want to see silver put serious points on the board.
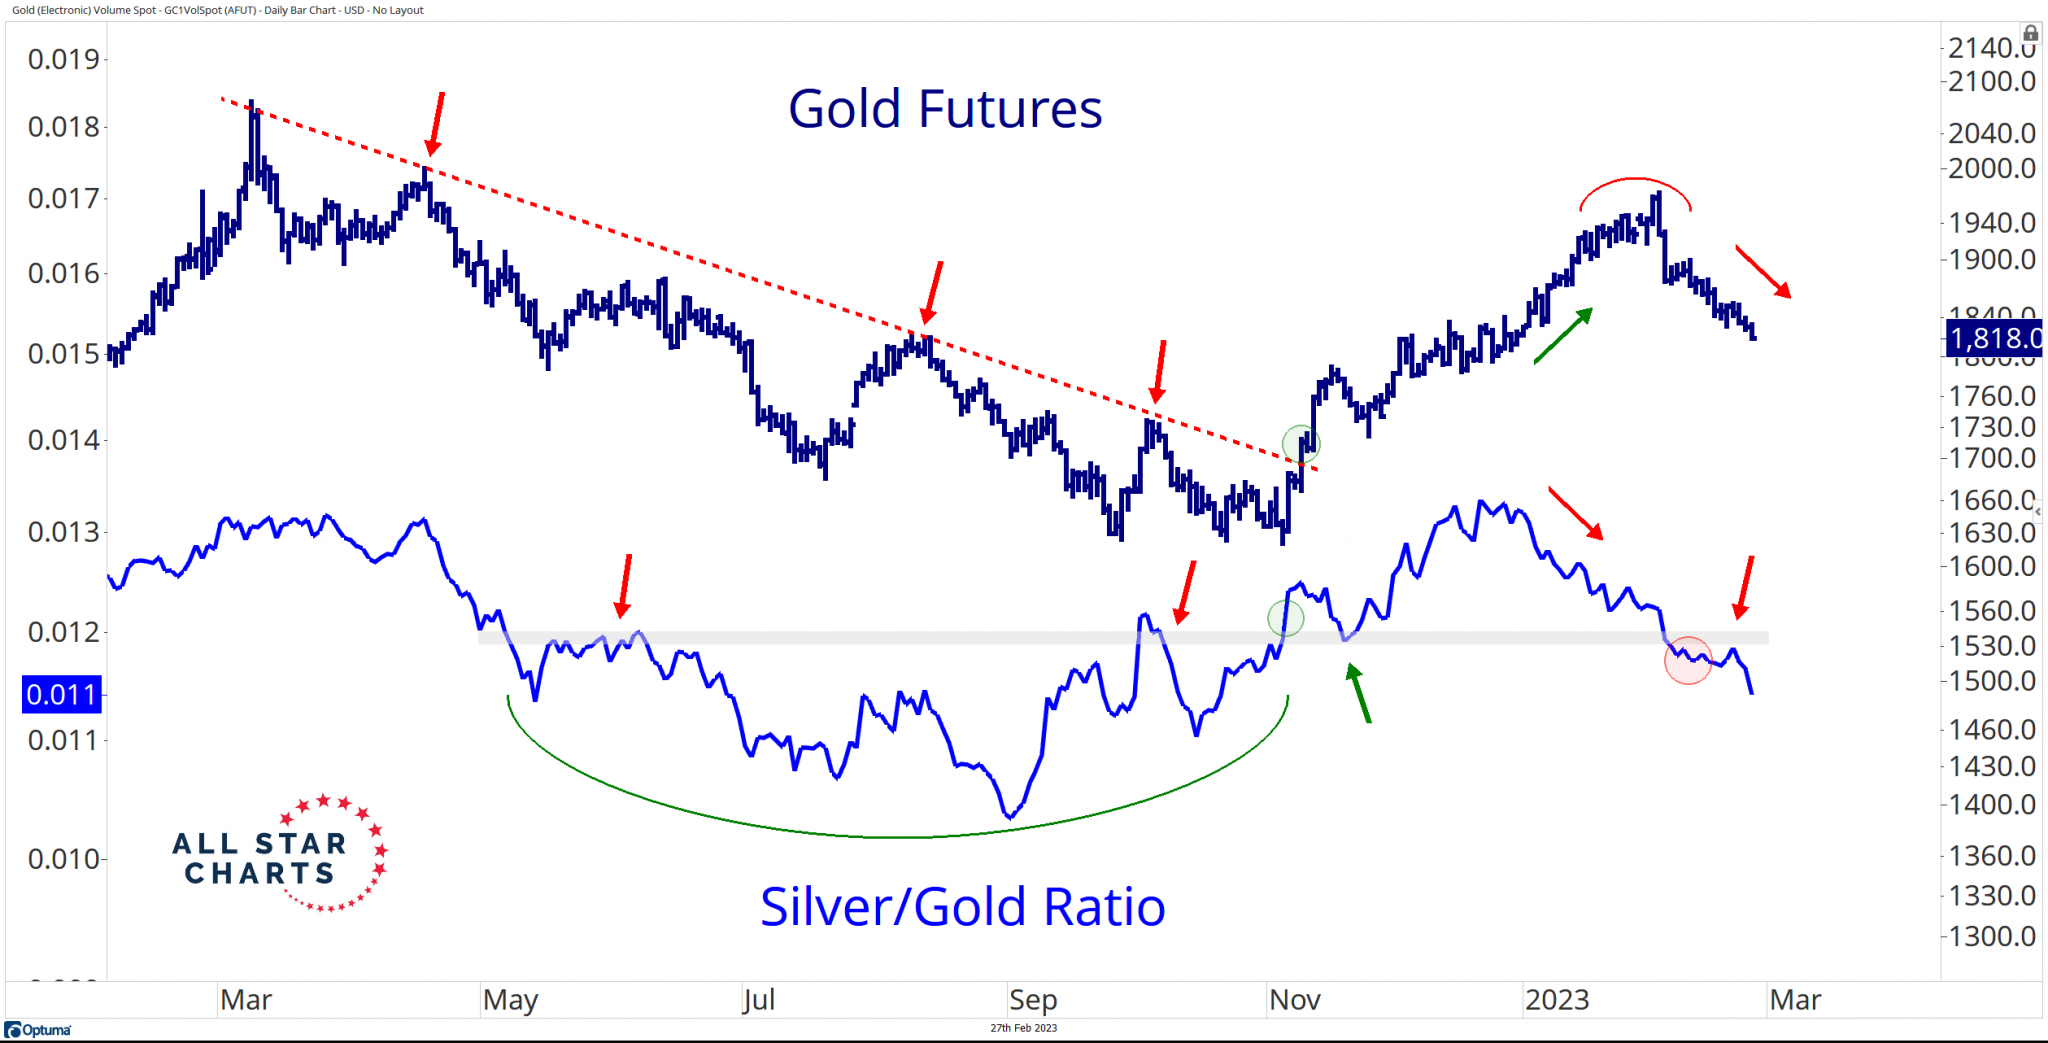
We monitor silver relative to gold to gauge risk appetite for the shiny rocks.
The overlay chart of gold futures and the silver/gold ratio illustrates why:
Silver’s bullish reversal relative to gold coincided with the yellow metal violating a significant downtrend line on absolute terms.
This is not a coincidence.
Buyers were entering the market, bidding up the riskier assets at a faster pace. That type of behavior bodes well for the entire space.
With silver breaking down on absolute terms and relative to gold, we must adjust our focus from overhead supply to potential support levels.
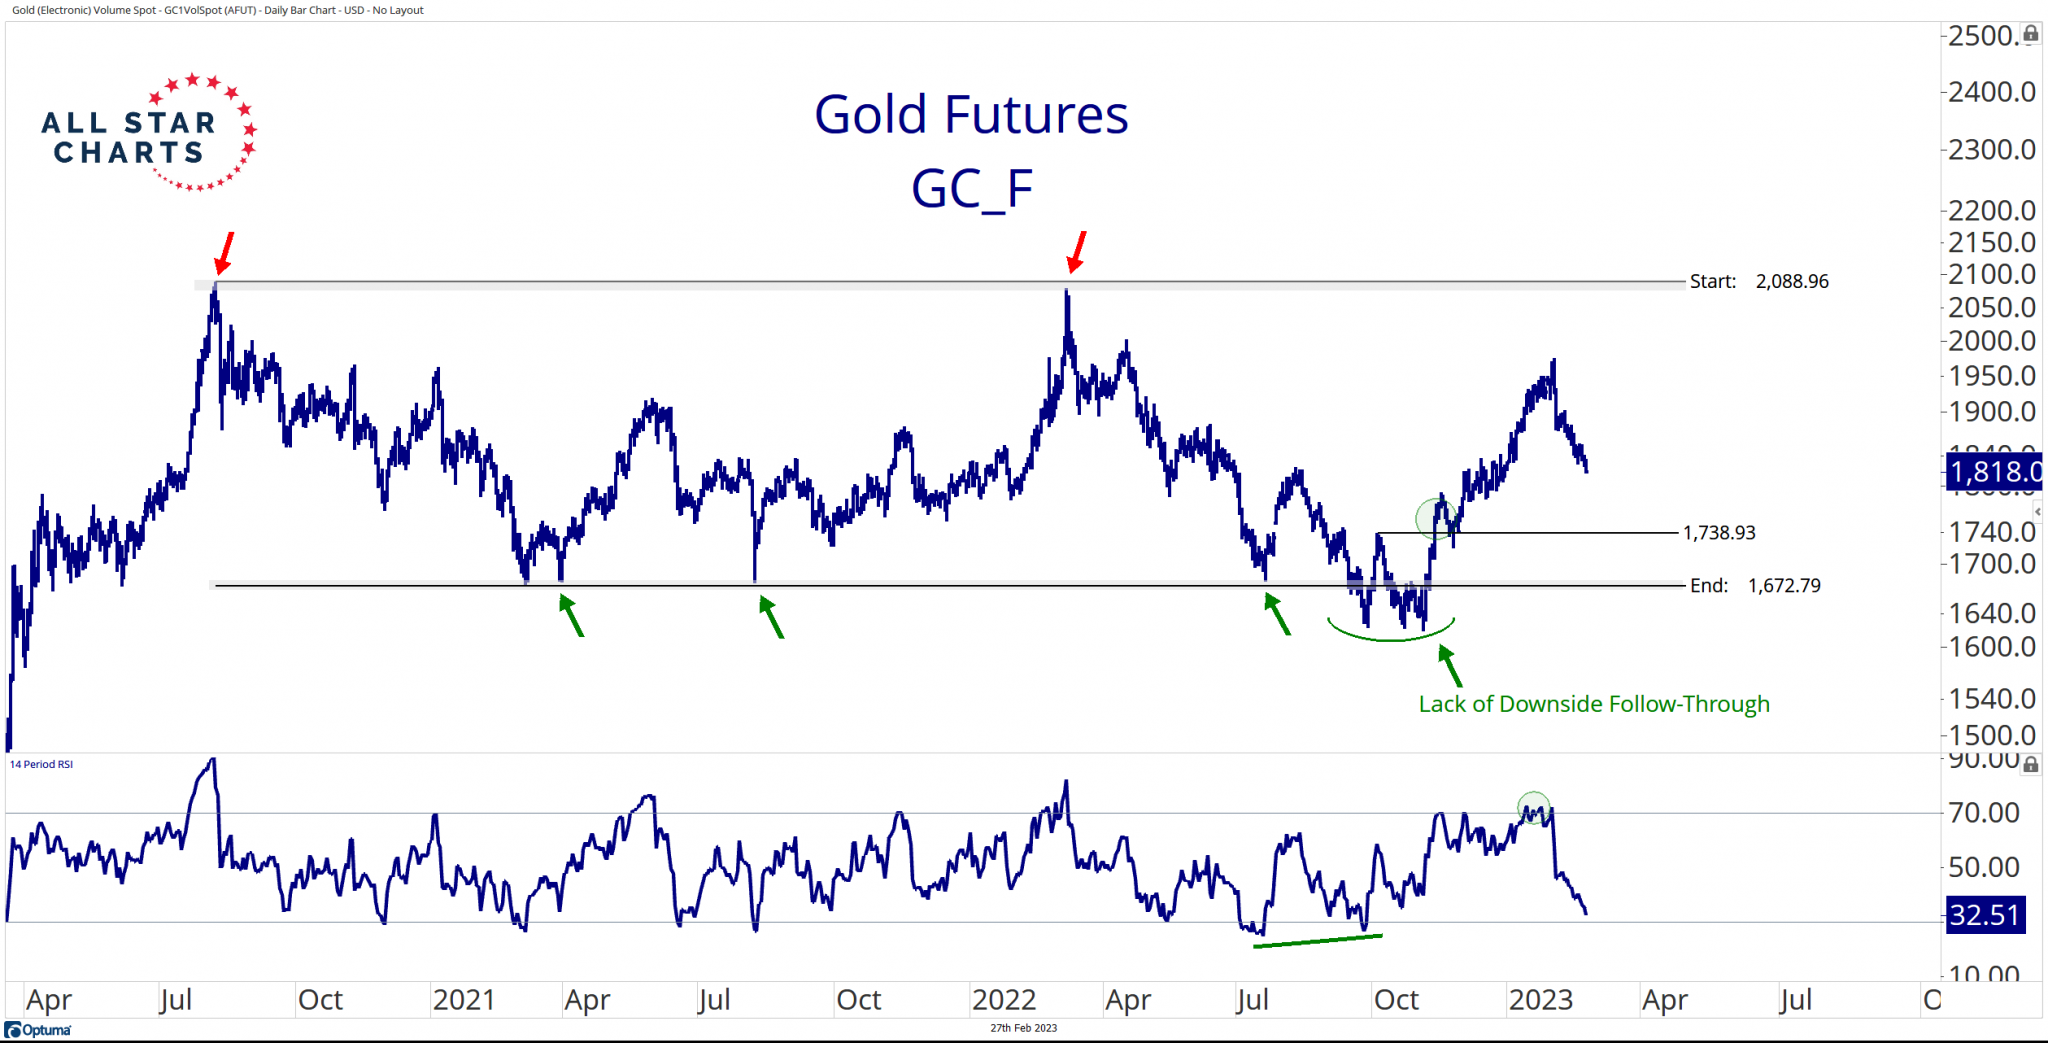
Check out the daily chart of gold, highlighting the lower bounds of a multi-year range:
Two levels stand out for gold futures.
The first is the early October pivot high of 1,738.
This level marks the initial bounce after the dollar peaked in late September. And it represents our first line in the sand as gold corrects lower.
If the bears push price below that level, we’re monitoring the shelf of former lows at approximately 1,675.
Silver is likely retesting its pivot lows for last summer if gold retraces to the lower bounds of its range.
We can gather insightful information from our language when discussing markets – or anything, for that matter.
For instance, the discourse shifts toward words such as demand and support and away from the terms overhead supply and resistance when it comes to gold and silver – and rightfully so!
Our language should reflect what we see in the charts.
And, right now, it’s not bullish.
It’s simple: The above charts need to catch higher – or at least stop going down – before you can step up to the line and lay your money down.