As you guys know very well, we have wanted to be short the majority of the U.S. Sectors and Sub-sectors coming into the new year. While we still have much lower downside targets from a structural perspective, tactically speaking, many of our targets were hit this week. This is where we wanted to be covering short positions and, for the most part, looking to reinitiate short positions if and when we get a corrective rally. I have just updated all of the U.S. Sectors and Sub-sectors and they can be seen in the ChartBook.
[Premium] Our Weekly Letter About The Current Market Environment
In this week’s members-only letter we discuss the following topics:
- The Sell-off to Start The Year Is Perfectly Normal and Was To Be Expected
- What Do We Do With Apple Stock?
- Where Is The Best Risk vs Reward Now?
- My Favorite Emerging Market Short
- Where Do We Buy Crude Oil?
- Solar Energy Stocks Are What We’re Most Interested In
- What the Strength In Utilities Is Telling Us
Audio: The Current Market Environment
Thursday morning I was on the Benzinga pre-market radio show discussing our current market environment. I’ve been in a heavy cash position since March 20 so I am approaching this market from a very unbiased perspective. We get into a lot of intermarket behavior and sector rotation as we enter the second quarter.
Here is the audio in full:
[soundcloud url=”https://api.soundcloud.com/tracks/198922969″ params=”auto_play=false&hide_related=false&show_comments=true&show_user=true&show_reposts=false&visual=true” width=”100%” height=”350″ iframe=”true” /]
Click Here for more information on our Premium Technical Research Packages

Tags: $T $IYZ $SPX $IWM $RSX $RUSL $USO $CL_F $XLU $IYR
Thinking Out Loud In Mid-January
Sometimes I just like to babble about what’s on my mind. It helps me organize my thoughts and you guys keep asking me to do more of this. So here’s what I’m thinking….
The year is off to a great start for us. I’ve never gone into a new year this prepared. Sunday night January 4th I couldn’t even sleep I was so excited. It was like I was a little kid on Christmas Eve. I keep a spreadsheet with a list of if/then statements where if certain things happen I would enter long or short positions in asset classes of all kinds. So far this year I’ve been in soft commodities, energy stocks, foreign stock markets and base metal stocks. Some of these were longs and some were shorts. If you follow my stocktwits and twitter streams, you pretty much know what I’ve been looking at.
This whole interest rate thing is hilarious to me. I never knew the bond market could be so funny. Wall Street Economists keep telling us that rates are going higher and I have no idea what they’re looking at. Why on earth would they think that? Fed Fund Futures keep pricing in lower and lower probabilities of the first hike at the October meeting. Last I checked we were now down to just a 56% chance, down from over 80% last week. It’s hysterical to me.
I get asked every day when Crude Oil is going to bottom. I really have no idea. Bearish sentiment is stretched to levels rarely ever seen before. But that alone is not a reason to buy it. I’m looking for a momentum divergence to even think about putting on a position and so far we have not gotten it. We can put Unleaded Gas and Heating Oil in that same camp, with respect to both sentiment and a lack of momentum divergence. I don’t know when they will bottom. So we’re focused elsewhere. Euro is in that category too. Maybe they bottom simultaneously. We’ll see…
Natural Gas has exploded this week. To me, this one came out of no where. Earlier in my career I would have gotten upset with myself for missing this move. But now I realize that there is no reason to get mad. Looking back at the setup last week, there wasn’t any reason why I would have bought it. I have to stay true to my process and wait for only the perfect setups. If something makes a big move and it wasn’t my trade, there’s no reason to be mad. It wasn’t for me. And still isn’t, for that matter.
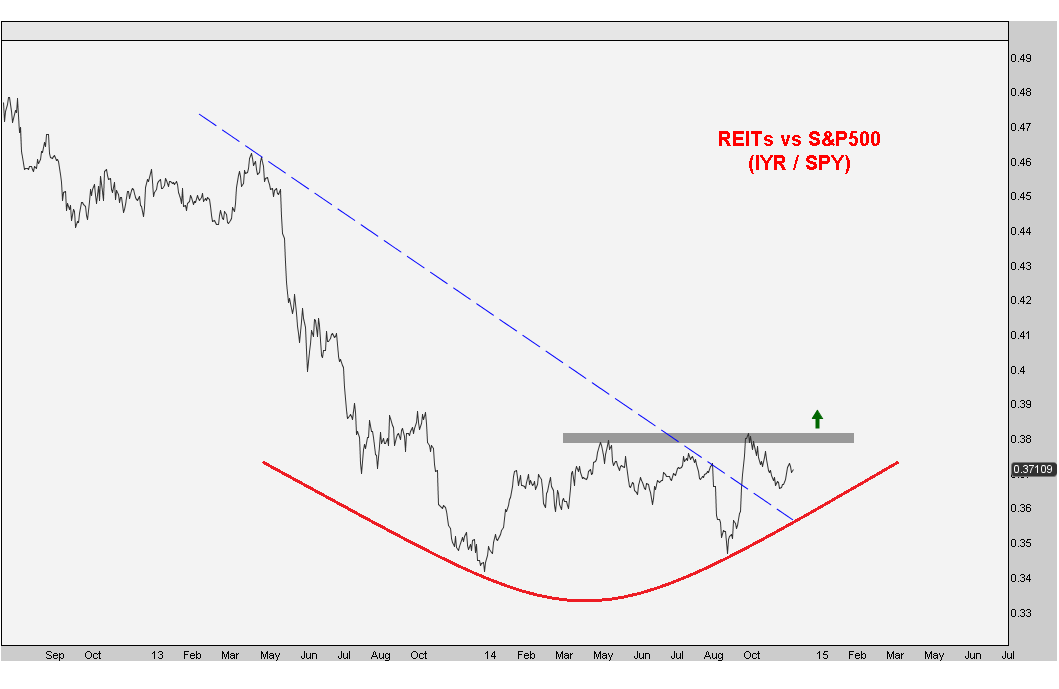
As far as US Equities go, I still don’t see any reason to put money to work up here in the major averages. One of my favorite positions so far this here has actually been a short SPY with a long REITs as a hedge. This has worked well and don’t see any reason why this still won’t work. I’m looking at 0.42 target on that spread (IYR/SPY). As long-term interest rates keep getting killed, there will continue to be a relative demand for higher yielding stocks. Fixed income guys aren’t getting their yield in the bond market. So they have to go to stocks. This is the reason I believe REITs and Utes doubled the returns of the S&P500 last year and will continue to do so in the first quarter.
I went to see Louis CK at Madison Square Garden last night. He was hilarious as always. So much fun. But I have a problem with the cavemen that run the arena. I get to the front of the line and show my tickets on my iPhone and these idiots make me go across the street to the Pennsylvania Hotel to print out the tickets. I couldn’t believe it. I thought this was 2015? I haven’t printed out tickets to a game or show in god knows how long. Anyway, I get to the hotel business center and there are 20 other angry people there printing out tickets wondering why we’re all doing this. And then if things couldn’t get any dumber, the guy’s gun to scan the bar code on the freshly printed tickets couldn’t even scan the bar code. He had to enter the numbers manually!!!! I couldn’t believe it. Still can’t. MSG get your act together. This is 2015 and we use phones not printers. And you wonder why the New York Knicks have the worst record in the National Basketball Association.
Some of the soft commodities are interesting. Coffee got off to a great start. We’re long Sugar futures currently and as long as we’re above the September lows, I love this one. OJ doesn’t look too bad either. My buddy Jonathan Krinsky at MKM Partners calls this the Breakfast Trade. Love that. I like Sugar the best of the 3.
Around the world I think we can see some nice mean reversions in countries that have been beat up. I like Malaysia down here. The risk/reward is definitely in favor of the bulls. I only like it above this week’s lows. Below that and things get messy.
Shorting Base Metals has worked out well for us so far this year. I was upset because we’ve had a small position. I didn’t want to chase it. This brings up an interesting point that has become the theme around the office this year. I think I’ve caught myself saying, “well that’s the downside of risk management” at least once or twice every day. It’s turned into a joke. But funny or not, it’s true. If you miss it you miss it. This isn’t venture capital where missing a good one could be a disaster. For us liquid market guys, there will be other opportunities.
Business wise things are going well. We’ve received great feedback from our subscribers about our weekly research reports. I love putting them together. This is really just my homework that I have to do anyway. I think of it as a professional athlete having to go to practice or to the gym. Even when it’s a Saturday morning or Tuesday late at night and I kind of don’t feel like putting in the work, I have to do it. No choice. I owe it to our paid members, I owe it to investors in our hedge fund and I owe it to myself. Hard work pays off. If I didn’t take the time to look at all of these charts, there is no way that I would find as many opportunities to profit around the world. I really want to have a great year, especially if the US Stock Market doesn’t do well. It will be nice to point to the success of an uncorrelated portfolio looking for absolute returns. I’m trying my best.
Solars are another interesting one. The trend here has been to the downside for almost a year. With downward sloping smoothing mechanisms on both daily and weekly timeframes, I think we break to the downside soon. Will that have anything to do with crude oil breaking to new lows? Possibly. But I want to be shorting these guys on a break of the lows from the 4th quarter. Solar stocks look terrible as a group.
Why are so many people lazy when it comes to math? I read things and am told things constantly that contradict 3rd grade math. I don’t understand. Interest Rates and US Dollars are positively correlated? What idiot told you that? When one is making new highs and the other is hitting new lows…..guess what? They’re not positively correlated buddy. The furthest thing from it in fact. I don’t get it.
I went to an art class the other day. It was so much fun. I’m not exactly the most artistic person. I’m not very good at drawing or painting. Although Howard Lindzon calls what I do “Chart Art”. But I had a blast at this class. It was at bar down in the Bowery. As it turns out my college buddy is dating this girl who is a lawyer during the day. But her heart and passion is really in art. So she decided to start this company called Art By Friends NYC. She teaches the class. So a few of us went to go support her. It was about 2 hours on Tuesday night. We drank wine, ate pretzels with a delicious mustard dip and my painting came out terrible. All good though. Some of the people in the class were incredibly talented. It was amazing how good some of these came out. But there was no judging. Everyone in the class was very supportive and friendly. Great time.
I don’t know when Copper is going to bottom out. It looks horrible. Structurally this is and has been a broken market that will take plenty of time to bottom out. We will get rallies, but I believe they will just be counter-trend in nature and the bottom will be a process. A long process. This tells me I need to keep looking at shorting base metals and base metal companies.
The metal I do like is Palladium. Relative to the others this is by far and away the best one. I want to buy this, but only on a breakout above 825. Below that and I don’t think there’s any reason to be involved long or short. The precious metals, gold, silver and platinum have done well so far this year and I think they have a little more upside maybe. But this isn’t something I want to fool around with. I think there are better setups elsewhere. But we’ll keep a close eye on them. Platinum to me has been the cleanest. I think we see at least 1350 on that one. Gold and Silver should benefit as well.
So that’s what’s on my mind.
What are you guys thinking these days?
***
Click here for more information on our Premium Technical Research Packages
Tags: $GC_F SI_F $PA_F $PL_F $PALL $GLD $SLV $PPLT $TLT $TNX $DX_F $UUP $KC_F $OJ_F $JO $SGG $SB_F $SPY $EWM $IYR $XLU $CL_F $USO $RB_F $UGA $HO_F $UHN $HG_F $JJC $UNG $NG_F
Are Utilities Breaking Out Relative to S&Ps?
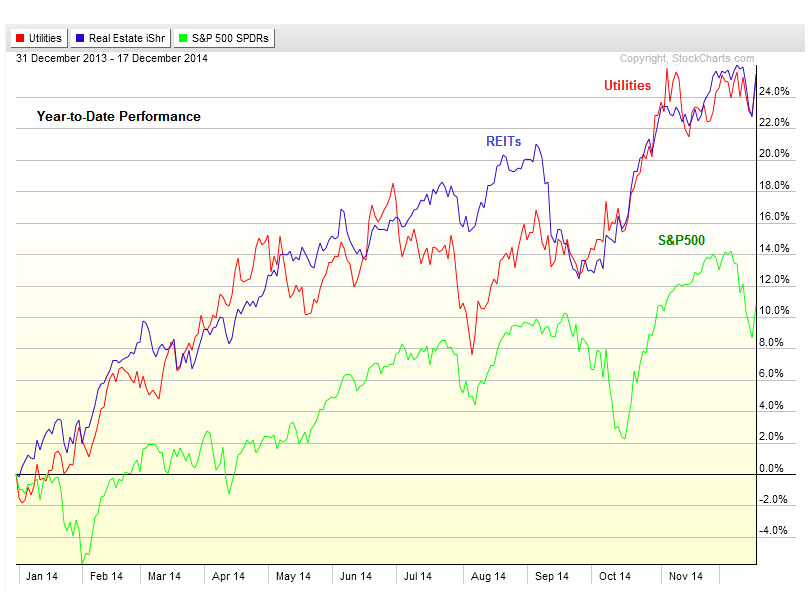
One of my favorite themes throughout 2014 has been that lower interest rates are here to stay. One of the big tells early in the year was the outperformance of both Utilities and REITs, which each pay some of the highest dividends of any of the S&P sectors. I was writing about this in February in a post titled, “These 2 Sectors Are Pointing To Lower Rates”. Sure enough, not only have Interest Rates fallen all year but each of these sectors are up 25% year-to-date while the S&P500 is up just 10% and some of the smaller-cap indexes are only up low single digits. Investors are not getting the yield they’re looking for in the bond market, so they turn to high dividend paying stocks instead. These two have therefore been the biggest benefactors.
So heading into 2015, how should we position ourselves for this low rate environment? I don’t see any reason to get cute. Short-term, yea Utilities did great this year. No doubt about it. But structurally they’ve barely even broken out. I think one of the more impressive setups out there has to be the longer-term chart of Utilities relative to the S&P500. Here is a weekly line chart going back to 2008 showing this falling wedge well-defined by two converging downward sloping trendlines:
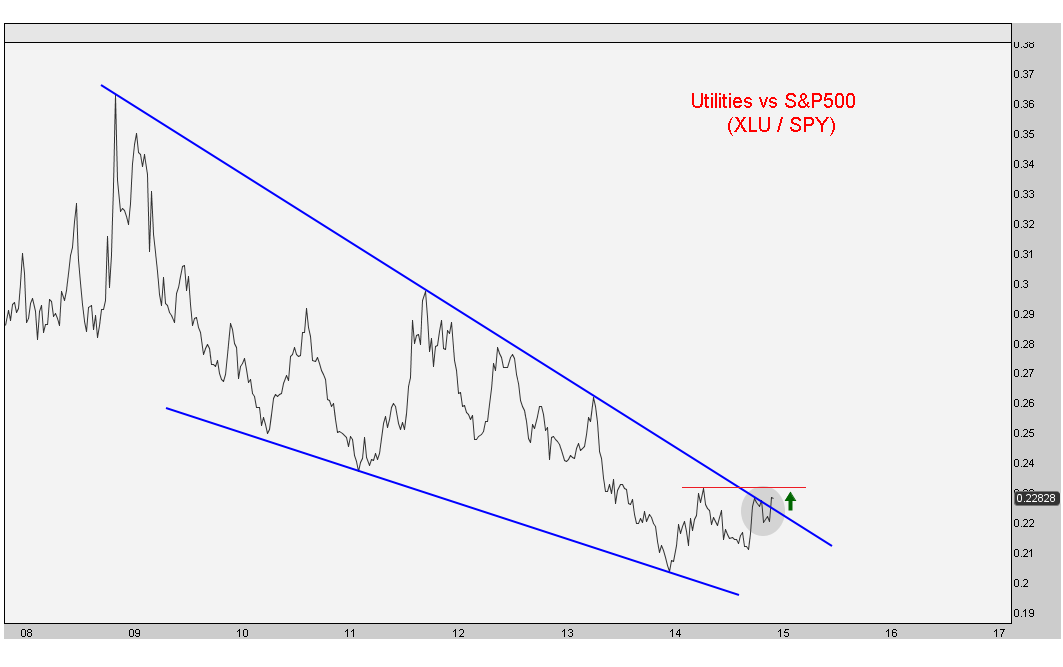
I think if this breakout is for real and can take out those April highs marked by the red horizontal line, we could really be off to the races. Not only can this be a great trade for 2015 (again), but would signal that interest rates aren’t going anywhere. The Fed Fund Futures market continues to price in record low rates for all of 2015 and these guys have been dead right from the beginning. The outperformance of higher dividend paying stocks confirms that and I believe that a big breakout in this chart above would really back up our low rates thesis.
Here is a closer look at the Utilities vs S&P500 chart above. This is a daily line chart showing the ratio bumping up against overhead supply 6 times since last summer. The more times that a level is tested, the higher the likelihood that it breaks out. So I think this one is poised to make a big splash in the first quarter:
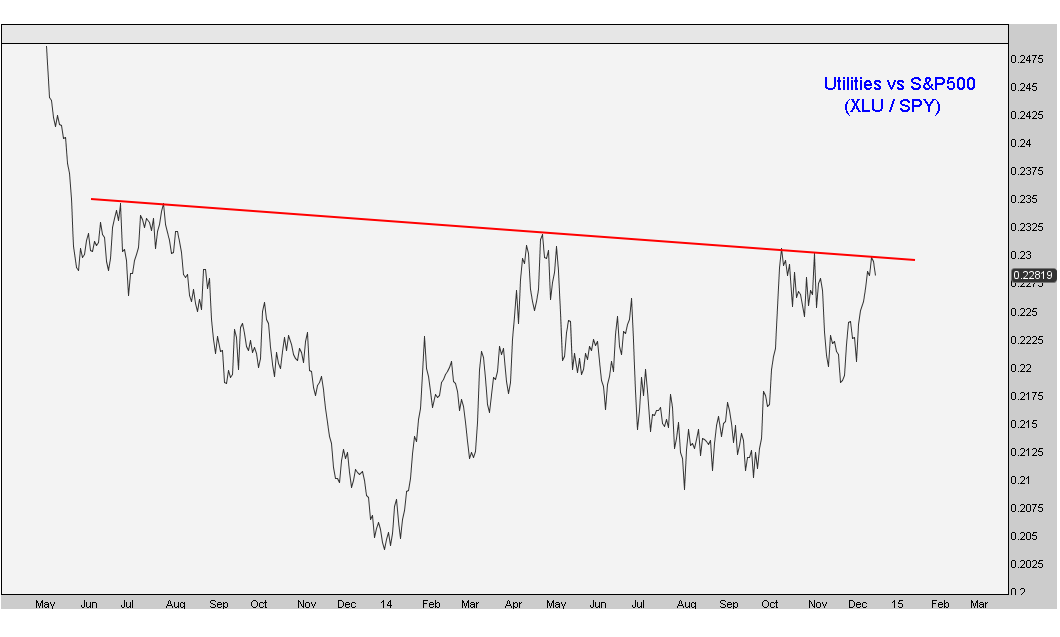
This is one of the more powerful themes around the world that I am currently watching.
Register Here to receive weekly updates on these charts along with 30 other Sectors and Sub-sectors on multiple timeframes.

Tags: $IYR $XLU $SPY
My One-On-One Interview With CEO.CA
Last week I sat down with the CEO Technician over at CEO.CA to talk about my methodology in the market, how I utilize sentiment, what I currently see in Energy, Metals and Interest Rates and to talk a little bit about our business, both the hedge fund and research products.
Here is the Interview in full:
J.C. Parets: “I see zero evidence that interest rates are heading higher”
POSTED ON December 07, 2014 BY CEO Technician

In the financial blogosphere, the cream rises to the top. JC Parets, Founder and President of Eagle Bay Capital, LLC, is one of the clearest voices on Wall Street today. As author of the popular technical analysis blog, All Star Charts, Parets, 32, has established a significant following (You may know him from CNBC and other frequent media appearances). We respect JC as a disciplined trader and market analyst; he is especially strong at risk management and often finds unique insights utilizing inter-market analysis. We had the opportunity to catch up with J.C. the other day and so without futher ado, here is our interview with J.C. Parets talking global markets…It’s great to have you here J.C., what can you tell us about your methodology for the markets? What do you look at on a daily basis?
Sure, the only reason why we are in the market is to make money. We aren’t journalists, we aren’t economists, the only reason we are in the market is to make money. So we are being very selfish in that respect, to make money for our investors. In order to achieve this goal I am constantly going out there looking for risk/reward opportunities that are very much skewed in my favor. We are looking for opportunities where for each $1 of risk we are able to make between $8-$12 in profit, so we are looking at 1:8 risk-to-reward opportunities. We are very picky.
We are able to do this because we look at such a broad array of markets and asset classes. We run a lot of spreads as well, where we can be long one market and short another etc. So for example if we want to be neutral precious metals as a group we can be long palladium and short silver, a trade which has worked very well for the past couple of years.
A few of the tools we are able to use to find the best risk/reward opportunities, obviously we are analyzing price because it is the only thing that pays. When we are looking at momentum I use a 14-period relative strength index, I do a lot of relative strength analysis, so not only on a particular stock relative to the overall market but also for example we will look at emerging markets as a group and compare countries within the emerging markets. So for example India has been showing relative strength compared to emerging markets as a group, Russia has been showing a lot of relative weakness compared to emerging markets as a group.
We also do a lot of seasonal studies. We have some proprietary models that we incorporate because during different times of the year certain markets behave in different ways. Not just the stock market, but commodities, fixed income, and currencies as well. And we also implement traditional pattern recognition, something that we kind of take for granted, looking at behaviors of the market in different patterns. As a technician that’s what i’m really focused on, price and pattern recognition. I also do a lot of Fibonacci analysis to come up with price targets and to manage risk.
How do you utilize sentiment in your market analysis?
More often than not there isn’t any valuable information we can take from sentiment. I only really start to pay attention to sentiment when we’re at extremes. For the most part sentiment is a bunch of noise. For example in the US stock market right now I believe that sentiment is just a bunch of noise – sentiment has been relatively bullish and we have continued to make new highs, but we have not seen extremes in bullish sentiment. Another example are metals, sentiment has been extremely depressed yet prices have continued to make lower lows. This sort of action is classic bear market stuff. Could we see a counter trend rally in metals? Sure. But is there enough evidence to say that this multi-year bear market in metals is over and we’re going higher? It’s way too early to say that, but short term we could definitely get another counter trend rally.
What are you seeing in crude oil after the big sell-off the past few weeks?
I really like to wait for the perfect storm in terms of sentiment, price, and momentum before I get involved in a market. In crude we are really only at extremes in terms of sentiment, there is really nothing else to suggest that now is the time to be buying. Are we close to a bottom? Yeah, I’ve got to believe that we’re close and the mean reversion process is likely to get going soon. I could see oil getting back to the low-to-mid $80s on a rally but we must remember that this will be a counter trend rally. Oil has been in a bear market since it topped at $147/barrel in 2008.
One of the best trades you’ve had during 2014 has been your long US Treasury Bond position which you’ve had on since January. What do you see from here and when will we know that we’ve put in a bottom in yields?
It’s a process and that’s what I think the academics and the economists don’t understand. It’s something that takes time and it’s not going to be a single event that’s going to be like “BOOM!! that’s the bottom in rates” and then we’re going to have a multi-decade bear market in bonds. I like to look at history, we can learn a lot from the past behavior of the market, especially a market like the US Treasury Bond market, a market that’s been trading for over 200 years. Historically speaking a bottom in interest rates takes 10-15 years to happen. I see zero evidence that interest rates are heading higher, in fact everything we were seeing back in January that made us bullish bonds we are still seeing now.
So to be clear, you are seeing no signs that we are near a bottom in long bond yields?
To the contrary, everything i’m seeing is telling me that interest rates are going to stay down. Look what’s happening in the stock market, what are the best performing sectors year-to-date? Utilities and REITs. This is yet another indication that rates are staying lower. The only people saying rates are going higher are the economists and the journalists, people who don’t put any money to work.
What are your favorite sectors and asset classes out there right now and what are your favorite charts?
We want to be in utilities (XLU) and REITs (IYR), these sectors are breaking out to multi-year highs. Tactically from a risk/reward standpoint it doesn’t get much juicier than this; we have a target on IYR of 85 and we only want to be long above 76, if it breaks back below 76 we will be out.
We also really like being short the Canadian dollar via being long USD/CAD. This pair put in a huge bottom and as they say “the bigger the base, the higher into space” – we have a 1.17 target for USD/CAD.

Relative to the broader market regional banks have been strong recently, this is a sector that I have previously been vocally bearish on, but recently I have been seeing some interesting things:

We are targeting $47.50 on KRE and with two weekly closes above $40.50 I will get long.
We also want to continue to be long S&P 500 (SPY) vs. short emerging markets (EEM). This has been a huge bottoming process and when we see huge bottoms like this one we need to respect it:

Thanks, J.C. Now what should our subscribers know about your fund and research services?
My #1 job is to manage money for my fund investors and if you would like more information on that please email us at info@allstarcharts.com. We also offer weekly chart research packages. For years I had been getting emails from people to launch some sort of subscription platform. Fortunately we were recently able to partner with some people on our back end so I could focus on what I do and we were able to launch these chart research products which are all detailed at www.allstacharts.com – every market we cover includes analysis on both weekly and daily time frames including momentum analysis, relative strength, pattern recognition, fibonacci levels, price target, and support/resistance. We currently offer 5 chart packages:
- Commodities and Currencies
- Dow Thirty Solution
- Global Markets
- S&P Sectors
- U.S. Major Market Averages and Interest Rates
I would like to thank J.C. for sharing his insights with us and I invite readers to check out his blog at www.allstarcharts.com and we can attest that his chart research packages are well worth the price of admission. You can also follow J.C. on Twitter @allstarcharts
***
Source:
J.C. Parets: “I see zero evidence that interest rates are heading higher” (CEO.CA)
Tags: $USO $CL_F $HO_F $RB_F $UGA $UHN $IYR $XLU $GC_F $GLD $SI_F $SLV $PA_F $PALL
What’s There Not To Like About REITs?
Please tell me that what is holding you back from buying REITs is a rising rate environment. Please oh please make that your excuse. Nothing would make me happier. I am constantly hearing from people who think theoretically and academically that rates are too low to be buying bonds and or anything that would benefit from lower rates. The more I hear these things from people who don’t put any money to work, the more I try and focus on what the actual market is doing in reality (which is where we live: in reality). The fed fund futures market has nailed this trade from the beginning as the theoreticians keep getting it wrong. Early in the year, (see here) relative breakouts in Utilities and REITs were agreeing with fed fund futures that rates were heading lower. Sure enough, not only did US Interest Rates get destroyed all year, but REITs and Utilities are each up 25% for 2014, more than doubling the returns of the S&P500. But now what? Why buy REITs up here?
Members of Eagle Bay Solutions have already been all over this trade, so make sure you are receiving these charts every week. Click here to register with us.
***
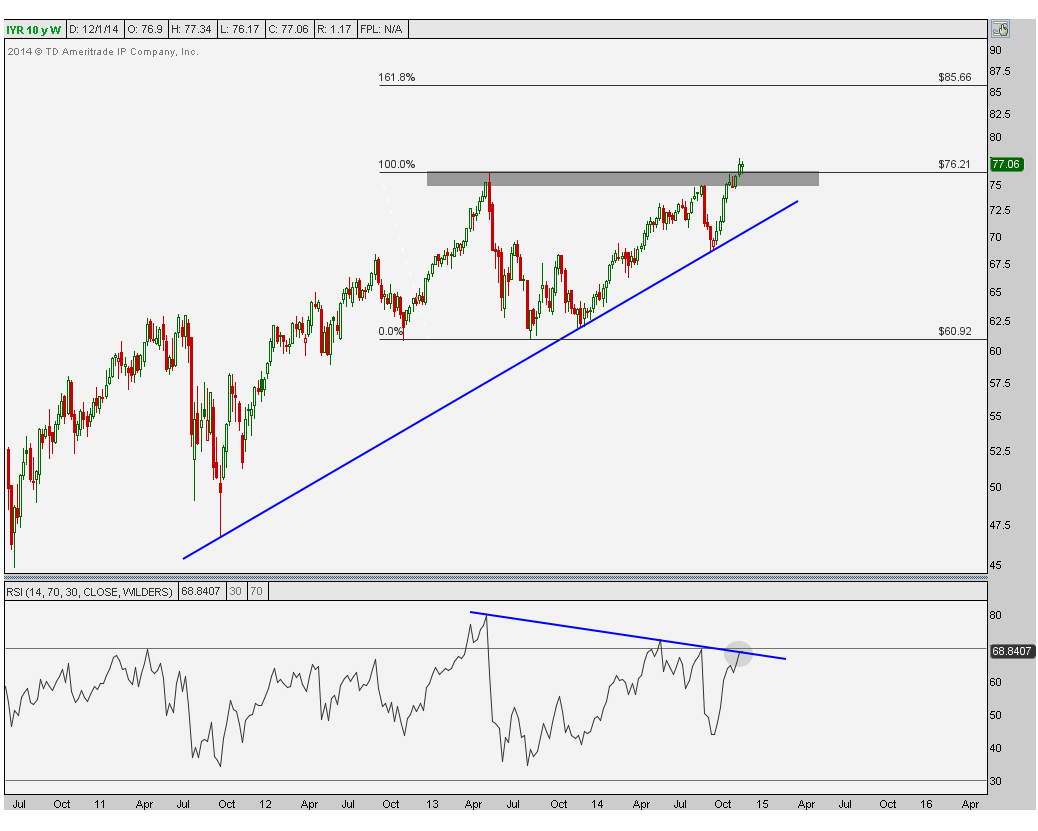
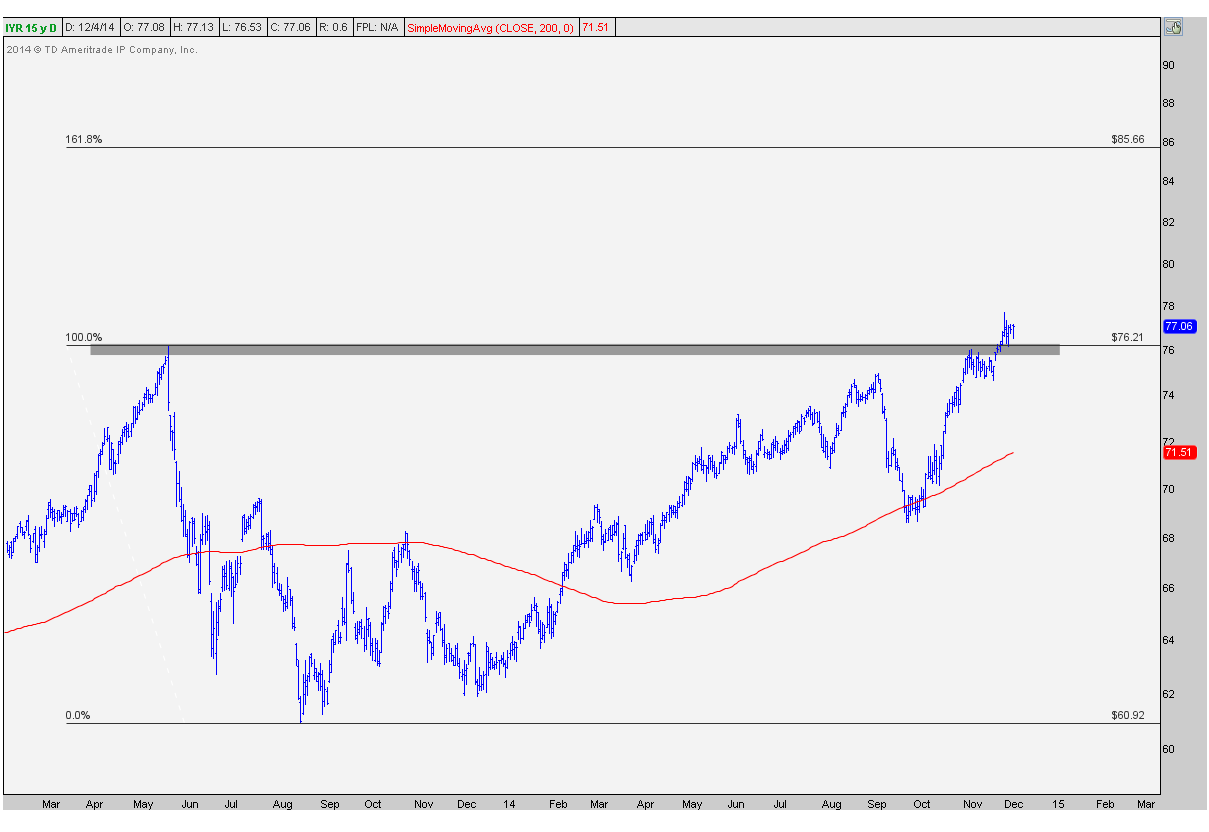
The first chart we are looking at shows the weekly candlesticks for $IYR, which is the exchange traded fund that tracks the Dow Jones U.S. Real Estate Index composed primarily of U.S. Real Estate Investment Trusts (or REITs). Look at prices not only holding on to the uptrend line from the 2011 lows, but over the past month have been breaking out to new highs with upside targets above $85 from a structural perspective. We arrive at this target based on the 161.8% Fibonacci extension from the 2013 decline. Also look at momentum working off this bearish divergence over time which cannot be more bullish. If we get a breakout in momentum above this downtrend line and RSI hits overbought conditions confirming what we are seeing in price, I think we can achieve our next upside targets a lot sooner than people think:
The best part about this trade is not that I like watching economists get it wrong or that I think the upside target is so far away from current prices. To me the most important thing that we can do as market participants is to manage risk. We are not sell side analysts, we are not journalists, we are not economists, we don’t have to “be right”. The only reason we are here is to try and make money. That’s it. So in order to make money consistently, we have to manage risk properly. In this case, we only want to be long REITs above the 2013 highs. Below that and we no longer want anything to do with it. There are no egos here. If prices fail and fall back below these key levels, then we’ll move on and go somewhere else. We have the luxury of being able to do that. Some others mentioned don’t have that ability. They have other factors that they need to consider.
The next chart is a relative one comparing the price of REITs to the S&P500. Look at this bottoming process over the past 18 months. We have already broken out above the downtrend line from early last year and all we are waiting for now is a breakout above the 2014 highs to confirm everything that we are seeing elsewhere.
Now, over the short-term I think we can see how important this key resistance really is. Here we are looking at a daily bar chart of REITs. We only want to be long above the 2013 highs, represented by the gray shaded area. Below that and there is nothing to talk about. Our upside target, based on this breakout is above 85 from the 161.8% Fibonacci extension from this entire bottoming process. Sure, can we go higher than that? Of course. But for now, this is out target and we will stick to that unless data comes in to suggest otherwise.
You guys know that I look at stocks, sectors, asset classes and really anything that trades liquid around the world. I am sitting here today telling you guys right now that there are very few things I see that present us with a better risk/reward opportunity. I don’t care if I’m right. I really don’t. That’s not what this is about. We are only here to try and make money. I spend my days searching far and wide for only the best risk/reward opportunities, and right now I think REITs are one of them. Money managers are not getting the yield they need out of the bond market, so they have to go into the stock market in order to get it. So for many reasons, I think they continue to pour money into this space.
Remember, long only above last year’s highs. Below that and there’s nothing to talk about.
***
Register here to receive weekly updates on these charts on multiple timeframes, with additional variables, pattern recognition, support and resistance levels, momentum analysis and up-to-date price projections.
Tags: $IYR $XLU $SPY $TNX
What Are The Best Sectors In America?
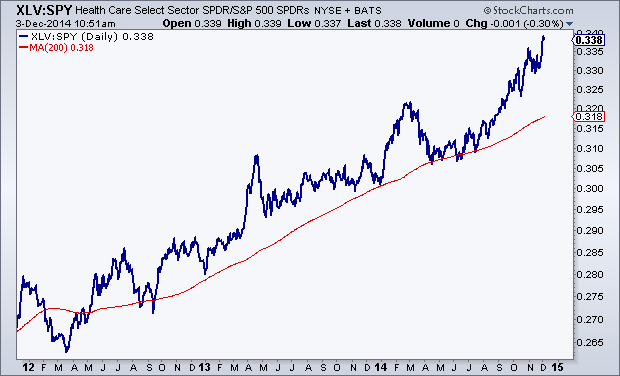
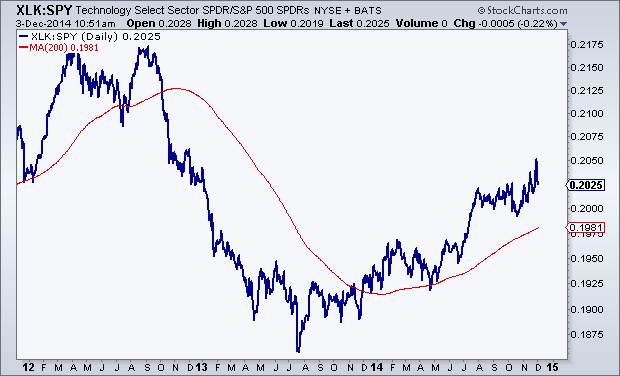
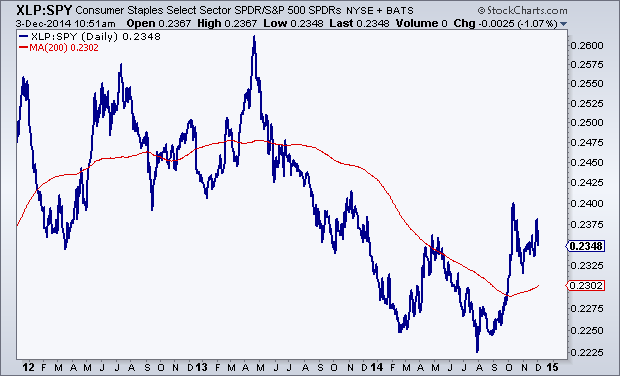
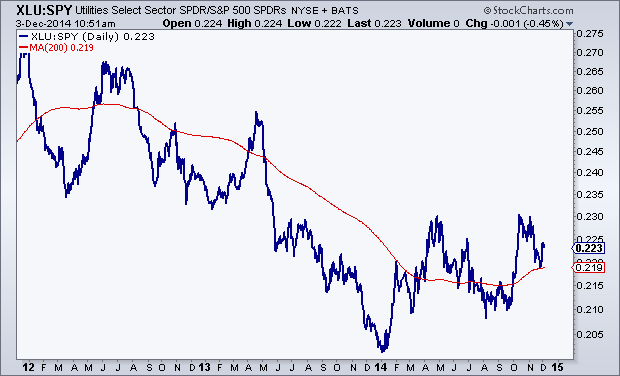
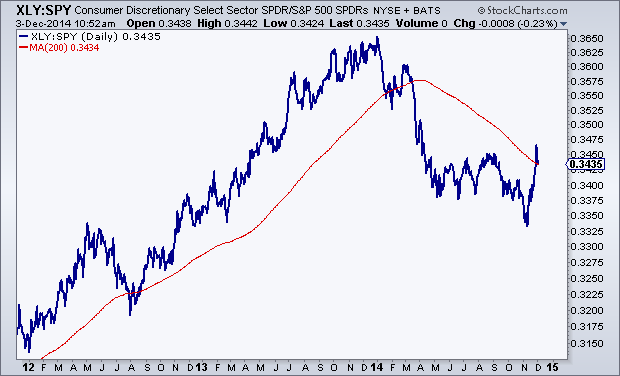
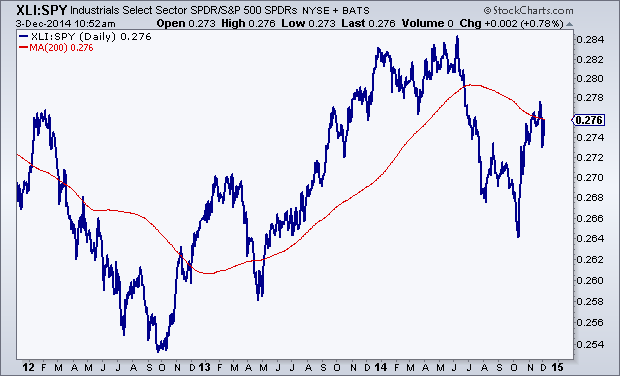
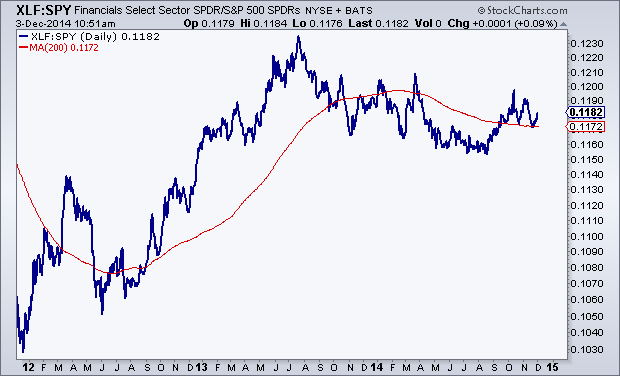
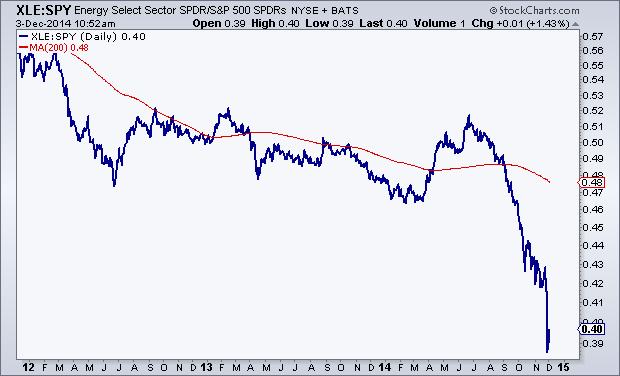
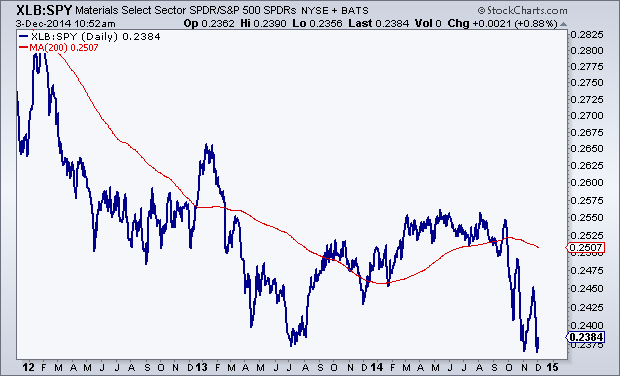
One of the exercises that I find really valuable is comparing the relative performance of each of the S&P sectors to each other. Today we are breaking down 3-year daily line charts of each sector vs the S&P500. I also include a 200-day simple moving average to not only help define the trend, but also to see where prices are compared to the long-term smoothing mechanism.
We’ll start with the best looking charts: Healthcare and Technology which have both been nicely above rising 200 day moving averages for some time now.
The next two: Staples and Utilities look like bearish to bullish reversals. These were previously in downtrends relative to the S&P500 but now appear to be turning up and trading above upward-sloping 200 days:
Consumer Discretionaries and Industrials have rallied back to their mean, but with a downward sloping 200 day, a neutral stance from a relative standpoint is likely best here:
Financials are just kind of there. The lack of trend tells us that they are trading with the market and are right near the mean. So not much to do here, although I would argue that they look better than the previous two above.
The last three are easily the worst of the bunch: Energy, Materials and Telecom. Each of them on a relative basis are well below downward sloping 200 day moving averages and other than perhaps a brief mean reversion, the trends here are still down. I would not trust these at this point to maintain a sustainable rally relative to the S&P500:

I like to do this periodically to get a good perspective on where money is flowing. I don’t really care what the sell side thinks in terms of over-weighting and under-weighting sectors. To me, price is what pays and the trends here (or lack there of) can be seen very clearly in the charts above. That’s enough as far as I’m concerned.
Members of Eagle Bay Solutions receive weekly updates on each of these charts along with the absolute price action itself. We have 5 different products from Commodities, to US Sectors, Dow Components, Global Equities and the Major US Averages. Click here to see which package is best for you.
Tags: $XLY $XLF $XLI $XLE $XLB $XLV $XLP $XLU $XLK $IYZ $SPY
- « Previous Page
- 1
- 2
- 3
- 4
- 5
- …
- 8
- Next Page »