Today Phil and I discussed the S&P500 short-term, a shrinking NYSE 52-week high list, Regional Banks at key support, Natural Gas reversing Thursday and BlackBerry’s weekly chart.
Enjoy!
Tags: $SPY $KRE $UNG $NG_F $BBRY
Expert technical analysis of financial markets by JC Parets
Today Phil and I discussed the S&P500 short-term, a shrinking NYSE 52-week high list, Regional Banks at key support, Natural Gas reversing Thursday and BlackBerry’s weekly chart.
Enjoy!
Tags: $SPY $KRE $UNG $NG_F $BBRY
It’s funny, when times are good and the security in question is hitting new 52-week highs, the commentary seems to revolve around “buying the dip”. We get that in US Stocks, we heard it about Japan this year, and in the Spring we were certainly seeing that “buy the dip” mentality regarding Natural Gas after prices more than doubled in less than a year.
Well, in Natural Gas we got it. A third of the entire move off last year’s lows has just been retraced. On Monday, Natgas Futures hit the lowest prices since February. So was that it? Was that the correction, the dip to buy, if you will?
I think it can be. Take a look at the daily bar chart of $NG_F
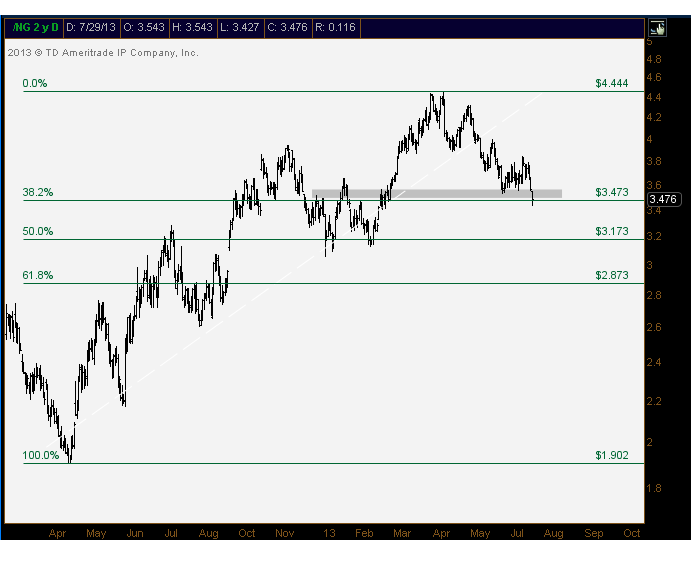
We’ve now retraced 38.2% of the rip-your-face-off rally from last year’s lows. And on these new lows this week, shorts are excited and longs are getting stopped out. This can be a nice recipe for a correction low in Natural Gas. I think we can look at $3.50 as a key level. This was support from the consolidation throughout most of July. And there is memory here from 6 months ago. So I think it would be a bullish development to see natty back above there.
Remember, the intermediate trend in NatGas is still up. And in the short-term we’ve seen a pretty steep correction. So I’d be at least watching this one a little bit closer down here.
Also See:
Trade of the Year? (ReformedBroker)
Tags: $NG_F $UNG
I dropped by the Nasdaq this morning to do a quick hit for Canada’s Business News Network. We discussed the the relative strength that Palladium is showing in the metals space, Freeport Mcmoran’s big potential topping pattern, and the continued lower lows and lower highs in Coffee.
Check it out:
Source:
Technical Tuesday – A Take on the Trade 7-9-13 (BNN)
Tags: $FCX $SPY $KRE $PALL $PA_F $NG_F $UNG $GLD $GC_F
I went down to the Nasdaq this morning to talk stocks, bonds and commodities on Business News Network. Check it out:
Source:
Technical Tuesday: A Take on the Trade (BNN)
Tags: $EWS $IDX $EIDO $EPHE $TLT $TNX $IEF TYX $NG_F $CL_F $UNG $USO
The Oil to Natural Gas ratio is still crashing. And maybe crashing is a harsh word, but I really don’t know what else to call it. If we were talking about the S&P500, it’s all you would hear about. But it’s one energy source relative to another, so it’s not sexy. But price is price right? At the end of the day, who cares what it is, as long as it’s liquid and we can trade it.
This particular pair was one that we discussed ad nauseum last year. Remember the good ol’ days when Oil/NatGas was up above 50:1??? At the time, people were acting like that was normal. You know, something that typically ranges around 10:1, now chilling up above 50:1. That was such a beautiful bubble that popped last year, and it’s still getting crushed.
Here is an updated chart of the pair.
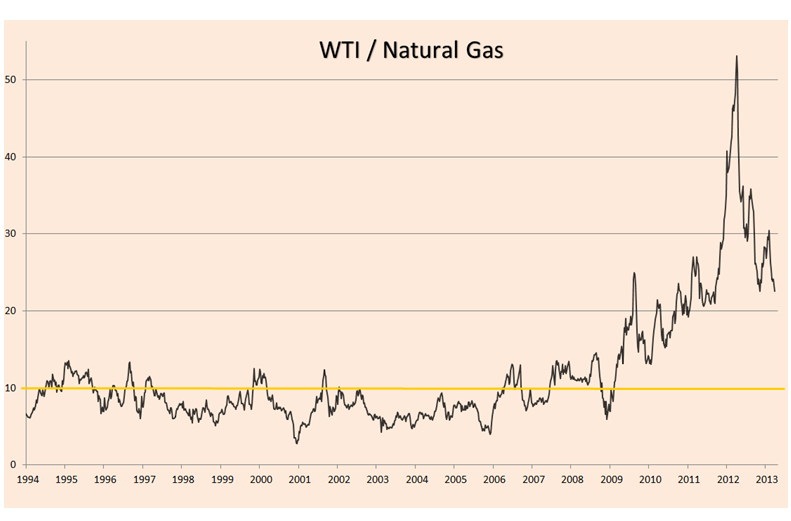
I’m out in California giving a presentation and was looking through some of my favorite charts. And this one has to be up there. So I was wondering why I hadn’t posted any updates on this lately. Here it is. Looks to me like it’s still going lower. Crude Oil seems to be on the verge of a breakdown while Natural Gas keeps on trucking to new highs. So the absolutes make sense. But the pair….the pair is the one. That historic mean down near 10 is calling my name. Can you hear it?
Tags: $NG_F $UNG $CL_F $USO
When it’s time to sit down and figure out exactly how we want our portfolio to be positioned, we start from the top/down. Diversification is not, buy everything and hope for the best. I think it’s important to take each asset class for what it is and decide how (and if) you want that to compliment your other assets. So we take stocks, for example, and ask ourselves, “ok do we want to lean long or short? smaller caps or larger caps? staples or discretionaries? emerging or developed?” Then we look at bonds, “do we want to be in Treasuries? Junk? Corporates? nothing at all? Long, short?” We also need to figure out how big we want our position to be in each asset class. Or do we even want to be them at all? This is all part of our diversified, non-correlated (target) portfolio.
So let’s look back and see how each of the major asset classes performed versus one another throughout 2012 (Click Chart to Embiggen):

Stocks led the way this year, as represented by the S&P500. Gold should finish the year positive while the rest of the CRB Index was dragged down by the struggling Crude Oil market. Treasury Bonds prices, while off the highs are still closing the year in the green. And with the Euro coming back hard off those summer lows, the US Dollar Index is going out slightly down for the year.
Correlations aren’t what they were a year ago and especially not what they were three & four years ago. So keep in mind that these relationships are constantly changing, and staying on top of these developments in the intermarket world really give you a leg up versus other market participants.
Intermarket Analysis is a very important part of our Technical work. Sometimes it gets forgotten as part of the study that we like to call Technical Analysis. But at the end of the day, we study price behavior regardless of the asset class. This is one of the many advantages that I feel technicians have over other forms of analysis. We don’t care what were looking at. Price is price whether the chart shows shares of $AAPL or the Crude Oil vs Natural Gas ratio. I can’t imagine not being able to do that.
Let’s use this time of the year to give this some thought. How do you think the intermarket landscape will be different in 2013?
Tags: $USDX $UUP $GLD $GC_F $SPY $TLT $CL_F $USO $CRB $NG_F $UNG
I dropped by the Nasdaq this morning to talk about Natural Gas and Gold on Canada’s Business News Network
Click for Video:

Related Video:
BNN: Rip-Your-Face-Off Rally in Natural Gas (March 1, 2012)
Source:
A Ripper of a Trade – What Now? (BNN)
Tags: $NG_F $UNG $CL_F $USO $GLD $GC_F $DJIA
When stock markets crash, you can’t pick up a newspaper or turn on the television set without someone writing or talking about it. The economic implications are clear, and therefore it deserves the press. But the price action itself is pure. The psychology behind it and the reversal in sentiment cannot be denied. So we need to keep in mind that although in some cases there is a ripple effect into our daily lives, other price crashes don’t necessarily have those repercussions. But it doesn’t mean that the price action isn’t exactly the same.
Here is a chart of 6 popular booms and busts in stock markets that have certainly made headlines over the years. We can see a lot of similarities in the behavior of these markets:

But crashes don’t HAVE to come in stock markets. They also don’t HAVE to come in absolute values. They can come in other assets classes and they can come in one market relative to another. One market crash, that I believe is still in the process of crashing is the Crude Oil to Natural Gas Ratio. While averaging about 10:1 since 1990, this market hit 54:1 this April and has been declining rapidly ever since. Last week we hit new 52-week lows of 22:1 in this market and we don’t see any evidence of the crash coming to an end yet.
I’ll be on Canada’s Business News Network today at 11AM EST discussing this ongoing market collapse. Check it out live if you can, otherwise I’ll post the video once it’s out.
* live interview postponed for Wednesday 11AM because of this: Goodbye Carney
Here is what the chart currently looks like:

Source:
The Greek Stock Market Collapse In Historical Perspective (PragCap)
Tags: $UNG $USO $NG_F $CL_F