Is this market fun or what?
Dr. Phil and I did a short video where we discussed S&P levels, Treasuries, Emerging Markets, Copper, Brazil and China. Check it out:
Tags: $FXI $TLT $ZB_F $DX_F $EEM $HG_F $IYR XLU $EWZ
Expert technical analysis of financial markets by JC Parets
Is this market fun or what?
Dr. Phil and I did a short video where we discussed S&P levels, Treasuries, Emerging Markets, Copper, Brazil and China. Check it out:
Tags: $FXI $TLT $ZB_F $DX_F $EEM $HG_F $IYR XLU $EWZ
I’m not so sure. This seems to be a big topic of conversation today. But I’m still not convinced that it’s time. Can they bottom out here relatively? Of course. But to me, if they do it would be coming at a pretty random area. However, let’s try to stay objective and look at just prices.
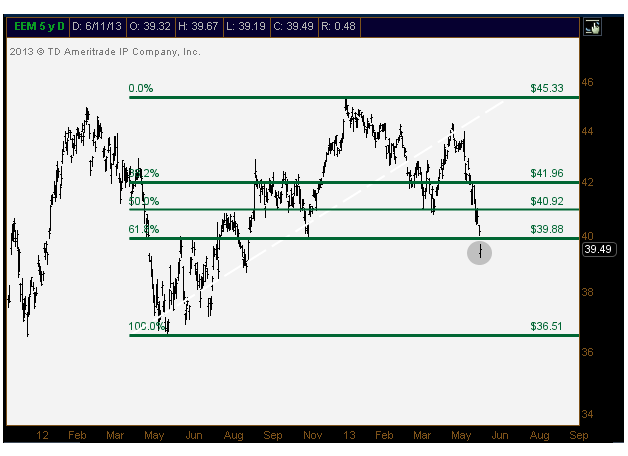
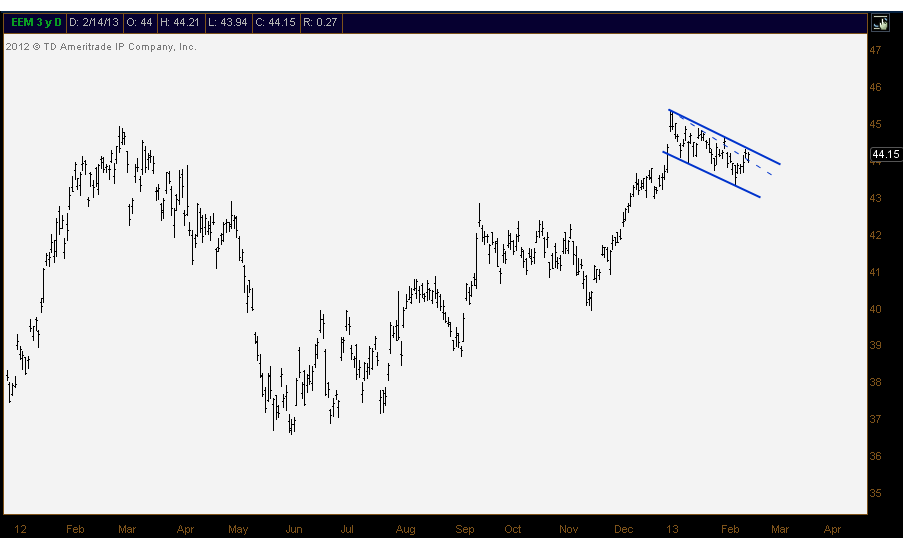
The first chart is the Emerging Markets ETF ($EEM). Tuesday morning’s gap lower took this below some key support levels that include last year’s November lows and the 61.8% Fibonacci retracement off the summer lows. If this is the bottom in $EEM then hey, what can I tell you? It came at a random level and I just missed it. I suppose you can come talk to me if we’re back above $40. Perhaps then maybe I can be convinced that they might be a long:
Now on a relative basis, I’d be lying if I didn’t say there were some interesting developments. We’re really pushing it here, but the $EEM:$SPY chart is meeting a few trendlines coming from different directions. On a daily closing basis, we’re approaching the uptrend line that takes you back to the 2006 lows (blue dotted line). You can also make the argument that the lows line up from this multi-year down trend. But again, I really think we’re pushing it.
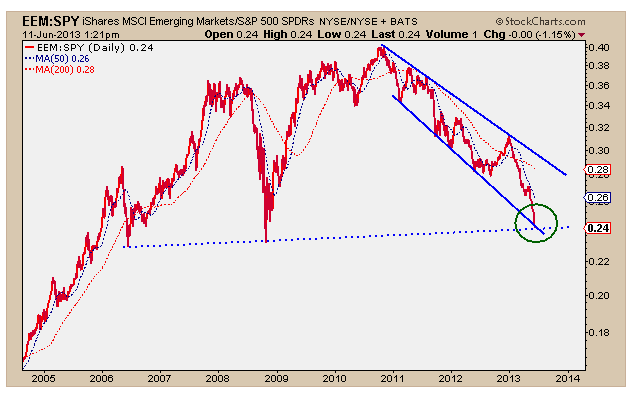
I suppose on a relative basis, the risk/reward here isn’t horrible. But on an absolute basis, EEM is tough to get involved with, at least for right now. I guess we’ll see how this week closes up and we’ll decide then. It’s just not for me right now.
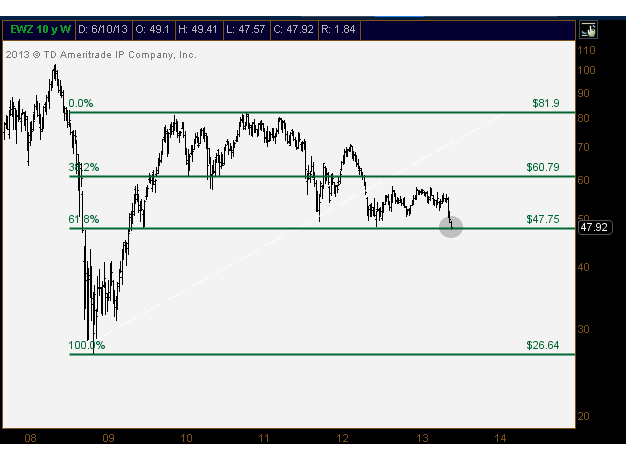
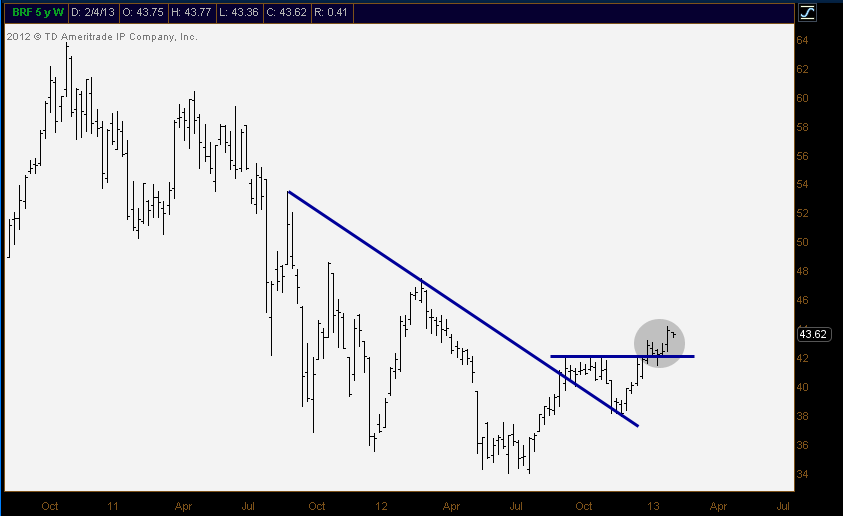
The last chart is Brazil. If you had to pick one emerging market that is at an area where you might want to give it a shot, I guess it’s the beat up Brazil. Prices are near the 2011 & 2012 lows and still holding the 61.8% Fibonacci retracement off the low lows of 08. But again, nothing that I’m in love with.
That’s how I see EM right now. I wish I had more conviction. But it’s just not there. What do you guys think?
Tags: $EEM $EWZ $SPY
Volatility is definitely picking up and the daily ranges have been getting bigger. So we’re trying to stay as market neutral as we can for now until the market takes us to levels where we can lean on the longer or shorter side. Here’s what we’re looking at today:
Tags: $VNQ $XLV $XLP $XBI $ILF $EWW $TNX $EPU $GXG $ECH $EWZ $XLF $SMH $INTC $TLT $FEZ
My buddy Joe Fahmy was nice enough to have me over to his office this evening to chat about the markets. Since we have the technology, we figured we should record it. Here’s how the video came out:
Make sure to follow Joe on Stocktwits & Twitter @jfahmy
Also check it his blog The Next Big Move
Tags: $FEZ $EWG $EWQ $EWD $ILF $EWW $EWZ $EPU $GXG $EPOL $DXJ $EPHE $EWM $EIDO $EEM
The Emerging Markets space has been a serial underperformer this entire year. Nothing but declines or sideways action so far as US Equities continue to grind higher. You can take Indonesia out of this particular conversation as it carved out a beautiful base last year and ripped higher recently. But the rest of the usual suspects, BRICs in partifular: Brazil, India, China, Russia have been struggling.
So I want to take a look at a relative chart of Emerging Markets and S&P500. This is a daily line chart of $EEM vs $SPY. Notice the beautiful breakout in October coming off that bullish divergence in RSI from the summer. This trend quickly reversed to start the new year and is now back to that former resistance.
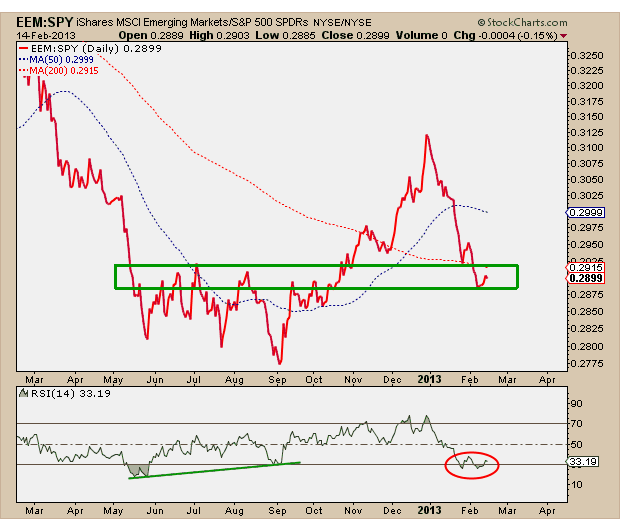
The good news is that this ratio has been absolutely crushed for 6 weeks, and if it is going to bounce, this would be a logical place for it to do it. The bad news is that RSI is showing some oversold readings that are not common for bull markets, quite the opposite in fact. So to me, it looks like these guys have some work to do. Furthermore, I think this is evidence that we still need to pick and choose from the space, rather than owning the group. Indonesia, as mentioned above, is so far bucking this EM trend.
The absolute chart of $EEM is interesting. Here is a daily bar chart of the group. What worries me is how long this (potential) flag formation is taking to develop. I would have hoped for a breakout much sooner if this was indeed going to turn into a bullish continuation pattern. It still can of course, but to me it looks like the likelihood is decreasing by the day.
An interesting group to say the least. I wish I could be more optimistic. But like I said, it’s “Show-Me” time.
Tags: $EEM $RSX $EWZ $PIN $SPY $FXI
We’ve been watching Brazil very closely throughout January as it consolidates in this tight range. When we find clean bases like this, it definitely catches our attention. The problem is that it hasn’t done anything yet this year to confirm its next up move.
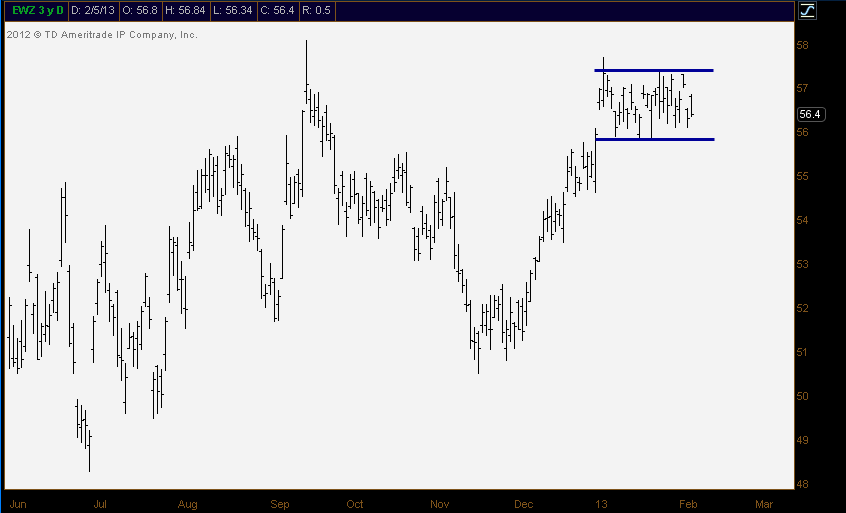
We’re looking at the MSCI Brazil ETF $EWZ. This is a daily chart showing the tight pattern throughout 2013. We want to start seeing some daily closes above 57.50 for confirmation, but there is a ton of upside potential in this one:
Here is a longer-term chart that shows why we think it’s promising. Last summer, $EWZ managed to hold on to its 2011 lows and has been rangebound ever since. This allows it to build up enough momentum to take it up to $70, which would be over 22% above the breakout levels mentioned above.

It’s not something we’re diving into blindly at this point, as it is still in no man’s land hanging around here in the middle of this 2013 range. But we have to keep a close eye on it due to the monster upside potential.
This is definitely an interesting one. Love the base, love the upside, love the easy out in case we’re wrong. All good things.
Oh yea, and the Brazilian small-caps already broke out:
Tags: $EWZ $BRF $EEM $BRF $EWZS
To me, Technical Analysis is a study of the behavior of the markets and market participants. This is as opposed to spending time worrying about all of the goods and the services that a particular market deals with. The way we look at it, if the only thing that’s going to pay us is price, then we should probably focus the majority of our attention on it.
Howard Lindzon was nice enough to invite me out to beautiful Coronado for this year’s Stocktoberfest. So I tried my best to explain our thought process when it comes to analyzing markets as well as our approach to portfolio management. Then we looked at some of our favorite trends and what we’re watching for 2013.
Here is the video of my presentation:
The charts might not be very clear in the video so I posted the slideshow here.
Source:
Stocktoberfest Friday Afternoon Part 1 (10.26.12)
Tags: $EEM $X $FXI $SPY $EWZ $BAL $EWJ $AAPL $RIMM $NG_F $CL_F $USO $UNG $GLD $DIA $DJIA