From the desk of Steve Strazza @Sstrazza
Check out this week’s Momentum Report, our weekly summation of all the major indexes at a Macro, International, Sector, and Industry Group level.
By analyzing the short-term data in these reports, we get a more tactical view of the current state of markets. This information then helps us put near-term developments into the big-picture context and provides insights regarding the structural trends at play.
Let’s jump right into it with some of the major takeaways from this week’s report:
* ASC Plus Members can access the Momentum Report by clicking the link at the bottom of this post.
Macro Universe:
- Our macro universe was positive this week, with 77% of our list closing higher with a median return of 2.96%.
- Lumber $LB was the winner again, closing with a 9.11% gain.
- The biggest loser was the Volatility Index $VIX, with a weekly loss of -7.28%.
- There was a 3% drop in the percentage of assets on our list within 5% of their 52-week highs – currently at 6%.
- Only 51% of our macro list made fresh 4-week highs.
- Meanwhile, 17% of our list made fresh 4-week lows, 13% made fresh 13-week lows, and 13% made fresh 52-week lows.
- The median asset in our macro universe is 21.2% below its 52-week highs (24.1% last week).
- 49% of our macro universe closed higher than their prior week’s high.
- Conversely, 17% of our list closed lower than their prior week’s low.
- 89% of our list is in a bearish momentum regime (no change from last week).
International Universe:
- Our International Equities universe was green as 87% of our list closed higher with a median return of 4.18%.
- Brazil $EWZ was the leader again with an 11.37% gain.
- Nigeria $NGE was the biggest loser, dropping by -4.57%.
- 68% of our international universe closed higher than their prior week’s high.
- While only 5% of our list closed lower than their prior week’s low.
- There was a 38% drop in the percentage of assets on our list within 5% of their 52-week lows – currently at 51%.
- The median asset in our international universe is 29.1% below its 52-week high (31.5% last week).
- 90% of our list is in a bearish momentum regime (no change from last week).
- 59% of our international list made fresh 4-week highs.
- On the other hand, 13% of our list made fresh 4-week lows, 13% made fresh 13-week lows, and 13% made fresh 52-week lows.
US Sector Universe:
- This week, our sector universe was positive, with 100% of our list closing higher with a median return of 3.54%.
- Small Cap Energy $PSCE was the biggest winner, gaining 8.42%.
- 70% of our sector list made fresh 4-week highs.
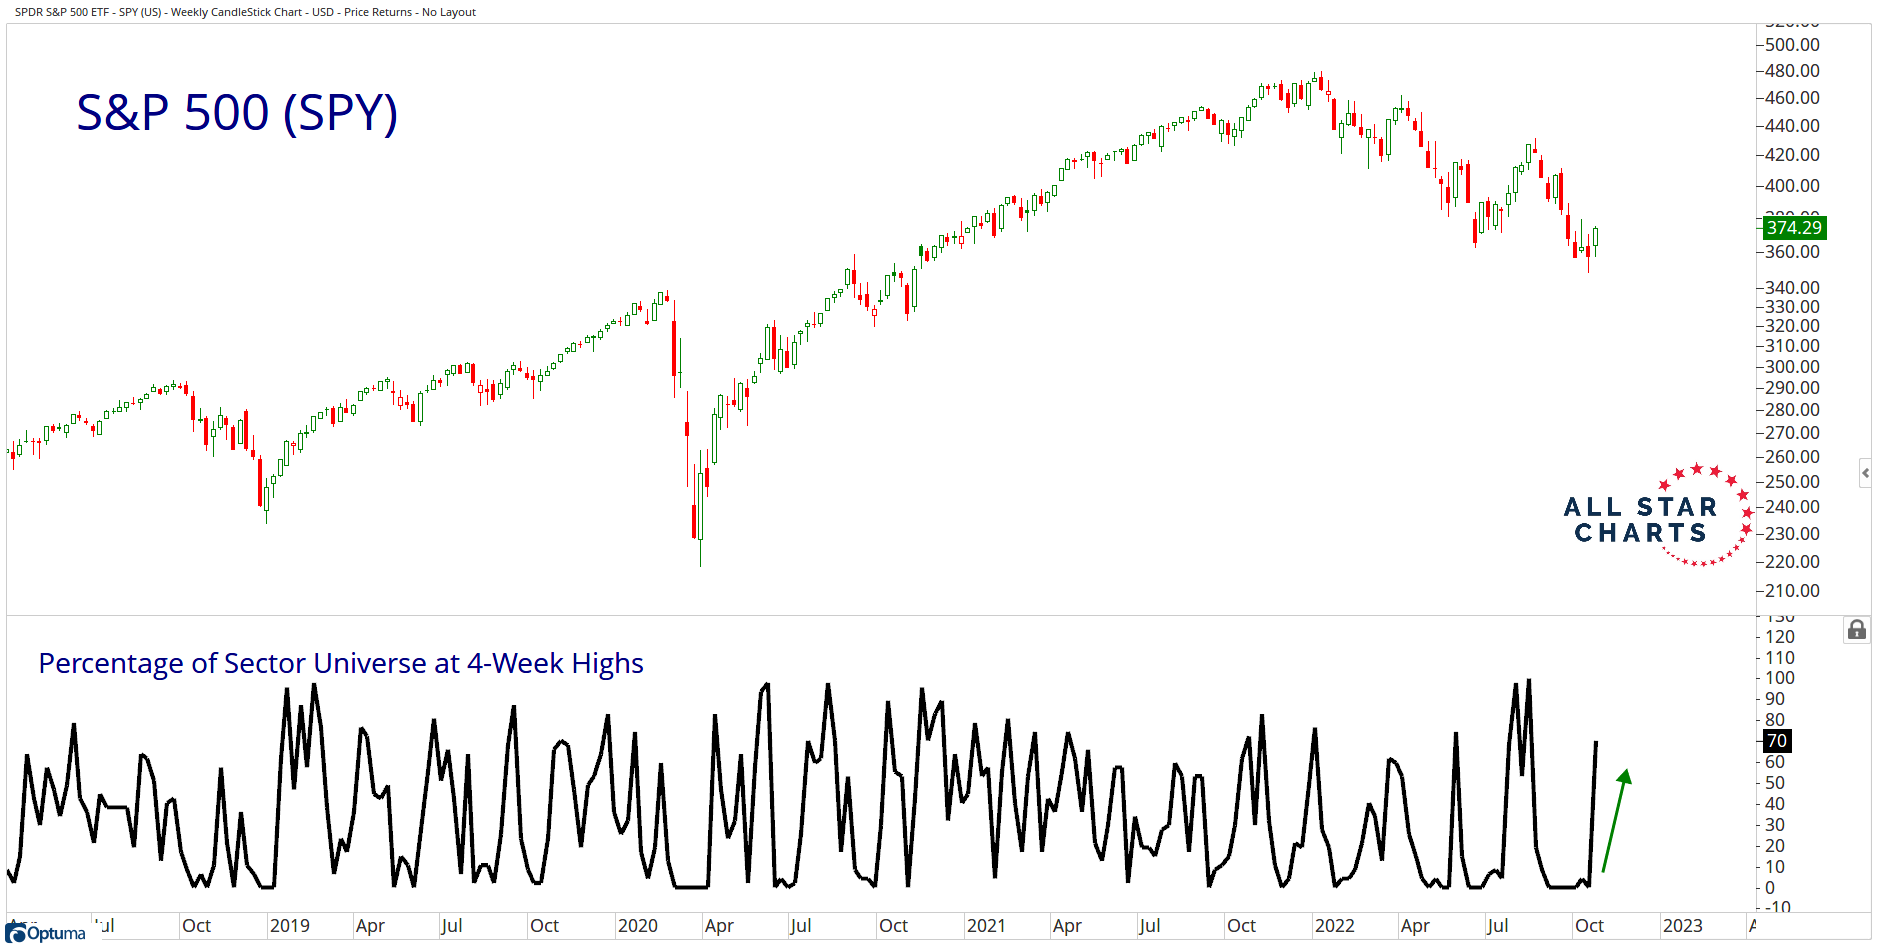
- On the other hand, 0% of our list made fresh 4-week lows, 0% made fresh 13-week lows, and 0% made fresh 52-week lows.
- There was a 40% drop in the percentage of assets on our list within 5% of their 52-week lows – currently at 85%.
- 47% of our sector universe closed higher than their prior week’s high.
- On the flip side, 0% of our list closed lower than their prior week’s low.
- 91% of our list is in a bearish momentum regime (no change from last week).
- The median asset in our sector universe is 20.4% below its 52-week highs (24.1% last week).
US Industry Universe:
- Our Industry universe was green this week as 91% closed higher with a median return of 4.86%.
- Oil Services $OIH led, gaining 15.54%.
- Regional Banking $KRE lagged, dropping -1.74%.
- 82% of our list is in a bearish momentum regime (a 2% gain from last week).
- There was a 40% drop in the percentage of assets on our list within 5% of their 52-week lows – currently at 20%.
- The median asset in our industry universe is 27.6% below its 52-week highs (compared to 33.0% last week).
- 47% of our industry universe closed higher than their prior week’s high.
- Meanwhile, 0% of our list closed lower than their prior week’s low.
- 64% of our industry list made fresh 4-week highs.
- On the other hand, 2% of our list made fresh 4-week lows, 2% made fresh 13-week lows, and 2% made fresh 52-week lows.
That’s it for this week’s highlights!
To access our Momentum Report, you must be a member of All Star Charts PLUS. Please login below or start your risk-free 30 day trial today.