Bull market? Bear market? Sideways market? That is the question on everyone’s minds.
We’ve put together the five most important charts we’re monitoring to help answer that question.
Expert technical analysis of financial markets by JC Parets
Bull market? Bear market? Sideways market? That is the question on everyone’s minds.
We’ve put together the five most important charts we’re monitoring to help answer that question.
Jeff deGraaf is one of those analysts who influenced me very early on. Something I’ve always admired about him is how much emphasis he puts on first identifying what type of market environment we’re in, before then giving more or less weight to different tools and indicators. This is one of those important steps that I think gets forgotten quite often when you see investors trying to always incorporate a certain strategy or approach regardless of the environment. In this episode, Jeff compares this stock market crash, and subsequent recovery, to others in the past including 1987. He does a nice job of incorporating what is currently taking place in Bonds and Gold into his analysis for stocks. I think there are a lot of great lessons in this conversation with, who I believe, is one of the best Technical Analysts in the world today.
JC recently posted some of the best charts from our US Chartbook, so I wanted to share those along with some of the best charts from our India Chartbook.
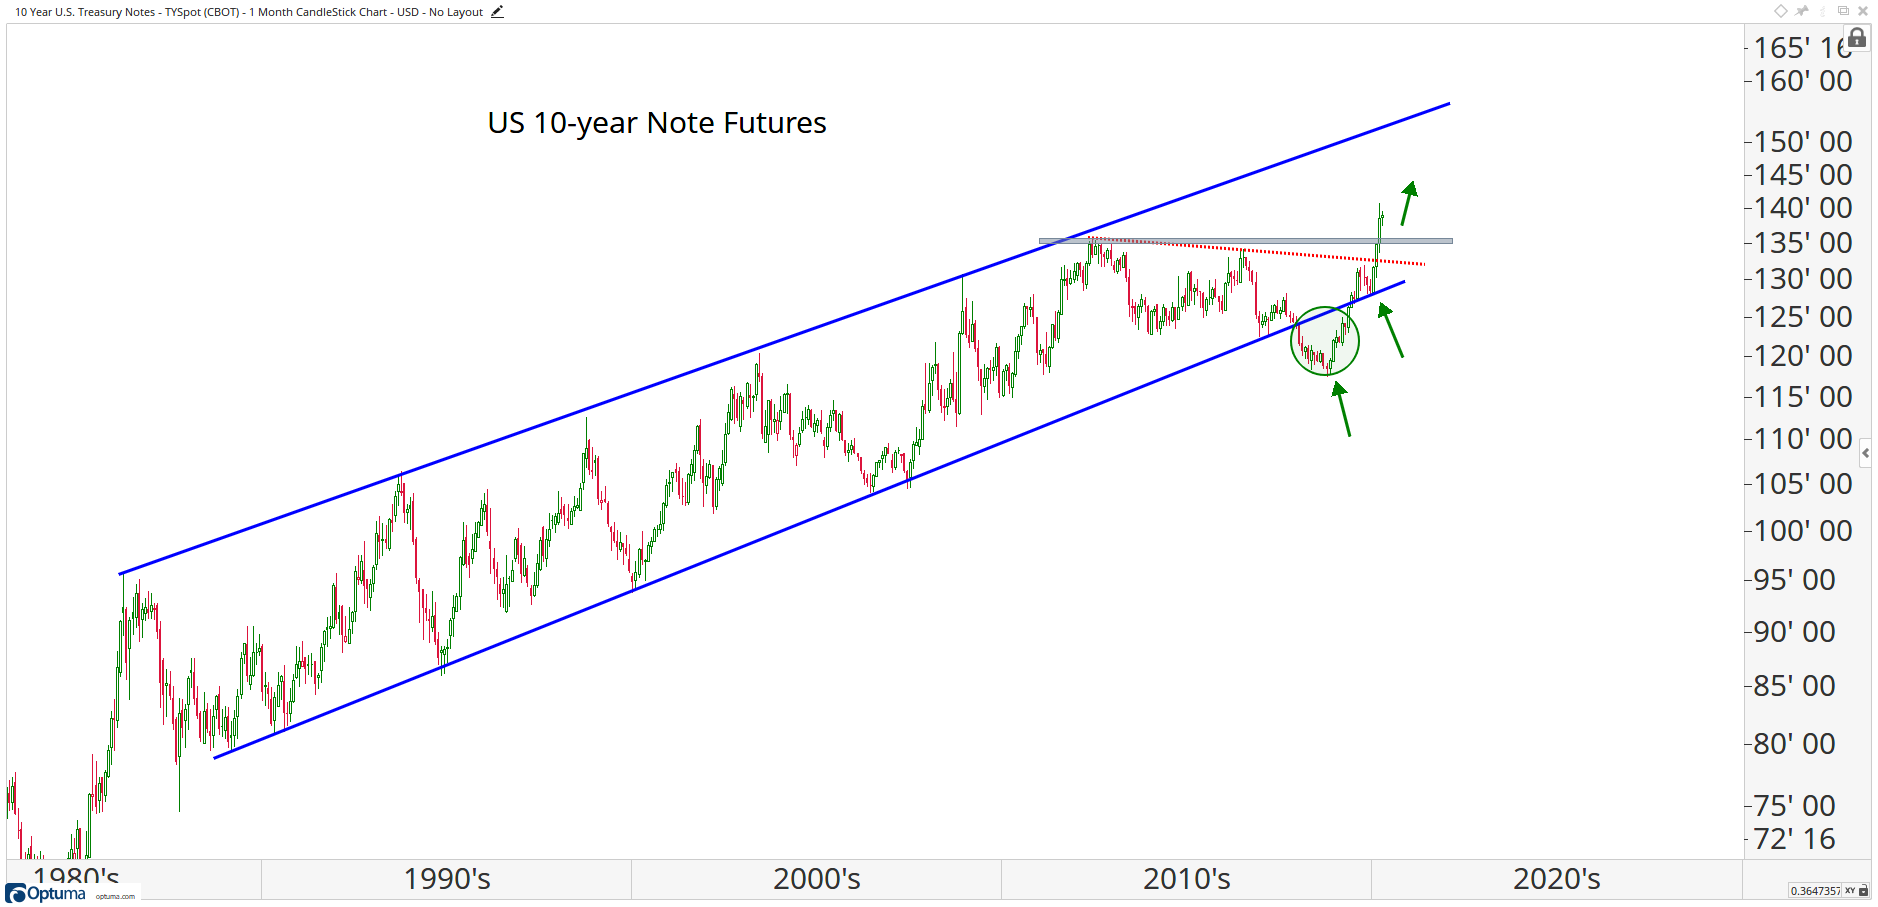
Let’s take a look at what’s going on in the major asset classes.
Let’s start with Bonds. Here’s the US 10-Year Note Futures printing their highest monthly close in history, clearly in an uptrend. The Bond market remains in an uptrend both in the US and most markets around the globe.
Click on chart to enlarge view.
The best part about the end of the month is that there’s always a fresh batch of Monthly Charts waiting for us. We only perform this exercise once the candlesticks are completed, which in this case was Thursday April 30th. It takes me about half an hour to get through them all, which represents roughly 6 hours of my entire year’s work. I promise you from the bottom of my heart that there is no single part of my entire process that I find more helpful than this monthly chart review.
You see, this process forces us to take a step back, and gives us no choice but to identify the direction of the primary trends. We use these to put shorter-term trends into context. So no matter what your timeframe is, I think first identifying primary trends, and then working our way down from there, is a huge advantage over a blind bottoms/up approach.
Here are the things that stood out most during my review: [Read more…]
Chris Ciovacco is someone whose work I’ve followed for many years. His approach to markets is similar to mine, in that he incorporates a weight-of-the-evidence technical strategy. His open-mindedness and ability to set up multiple outcomes to prepare for, is one to be admired. In this episode, Chris walks through his thought process when analyzing the current environment. He makes a great comparison to early 2009 and asks whether we’re in January ’09, just before another severe decline in stocks, or in May, on the way up after already bottoming.
This is a great episode that I hope makes you think differently and inspires you to keep an open mind and come up with your own possible scenarios for the coming months and quarters. This was a fun one! [Read more…]
Did you notice how Stocks, Bonds and Gold are all at or near 34-day highs? [Read more…]
Here is an update to our Bull Market Checklist of 20 Items.
*Note: The Sensitivity column represents how close the asset is to the risk level in question [Read more…]
From the desk of Steve Strazza @Sstrazza
For the week ended Friday, April 24, 2020:
Every weekend we publish performance tables for a variety of different asset classes and categories along with commentary on each.
This week we want to highlight the continued divergence between Energy stocks and Oil using our Sector and Industry ETF and Commodity tables.