This is what happens when you ignore price just because you’re too weak to overcome your ego:
Expert technical analysis of financial markets by JC Parets
This is what happens when you ignore price just because you’re too weak to overcome your ego:
This is the weekly post that aggregates all the charts we put together throughout the week and organizes them all into one, easy to flip through deck.

From the desk of Steve Strazza @Sstrazza
Our Hall of Famers list is composed of the 100 largest US-based stocks.
These stocks range from the mega-cap growth behemoths like Apple and Microsoft–with market caps in excess of $2T–to some of the new-age large-cap disruptors such as Moderna, Square, and Snap.
It’s got all the big names and more.
It doesn’t include ADRs or any stock not domiciled in the US. But don’t worry; we’re developing a separate universe for that, and we’ll be sharing it with you soon.
So, The Hall of Famers is easy.
We simply take our list of 100 names and then apply our technical filters in a way that the strongest stocks with the most momentum rise to the top.
Let’s dive right in and check out what these big boys are up to.
From the desk of Steve Strazza @Sstrazza and Ian Culley @Ianculley
Whether we’re talking about stocks, commodities, currencies, or even the bond market, things have been a total mess. It’s no secret, and you’re probably tired of hearing it by now.
Trust me, we’re just as tired of seeing it.
So, as these choppy conditions test our patience and discipline, why not use this opportunity to take a step back and examine where we’ve come from, where we are now, and where we’re likely headed.
In today’s post, we’re going to do just that by revisiting and analyzing some of our favorite breadth indicators and discussing what some of them are suggesting for commodities over the long run.
Let’s dig into it! [Read more…]
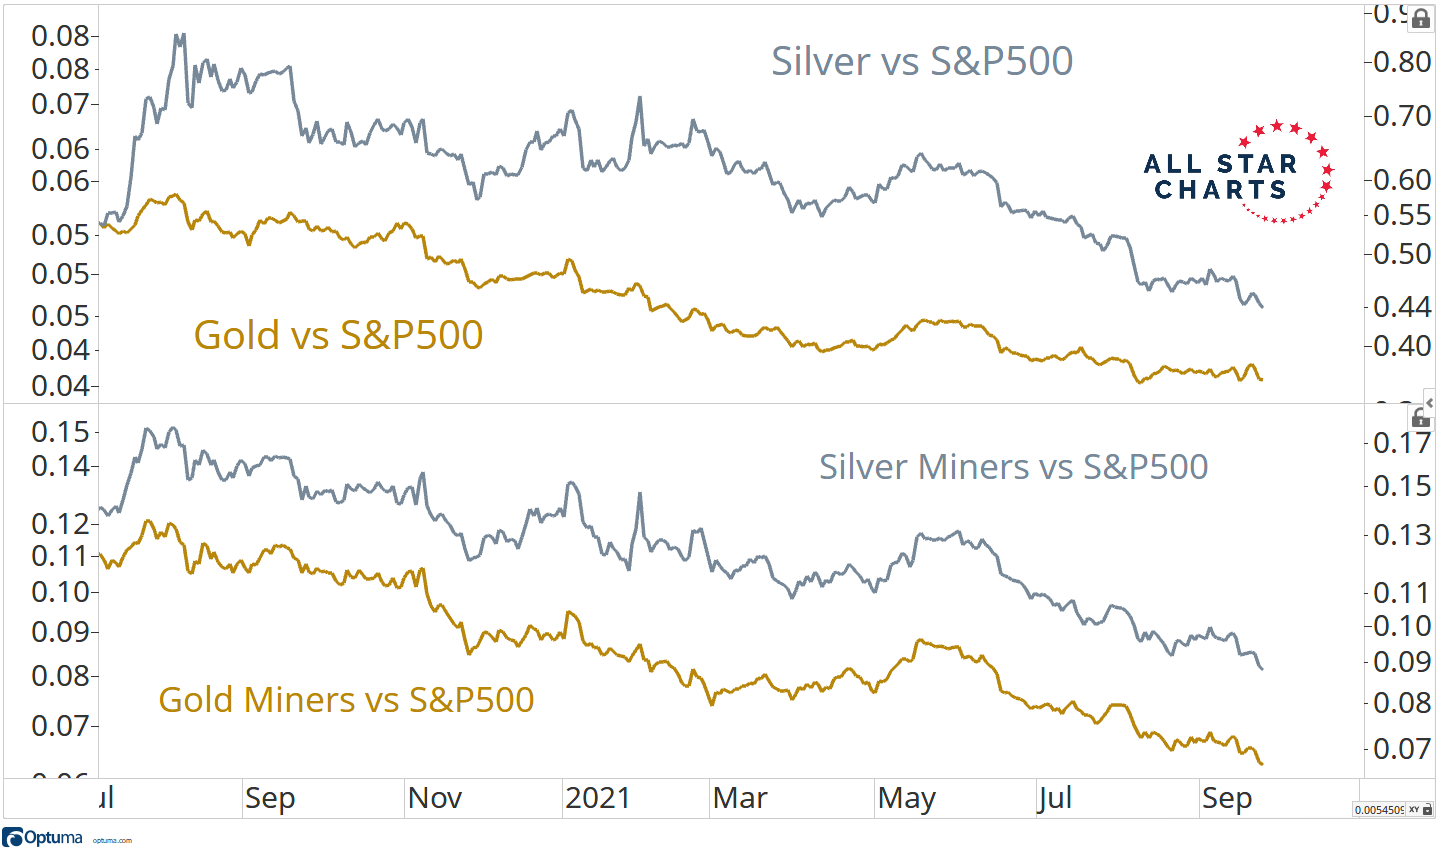
From the desk of Steve Strazza @Sstrazza and Ian Culley @Ianculley
I was talking to the team earlier this week and mentioned that I was having a hard time writing. Grant and Ian were quick to remind me that it’s probably because “nothing new is happening!”
They were right. Until now…
We finally got a major resolution in what we consider one of the most important charts in the world these days.
I’m talking about the US 10-year yield reclaiming that critical 1.40% level this week. And this begs the question as to what a rising rate environment might mean for investor portfolios.
Well, one thing we know for sure is we want to stay away from bonds… unless we’re shorting them.
But how do we want to position ourselves in the stock market if yields are breaking out? [Read more…]
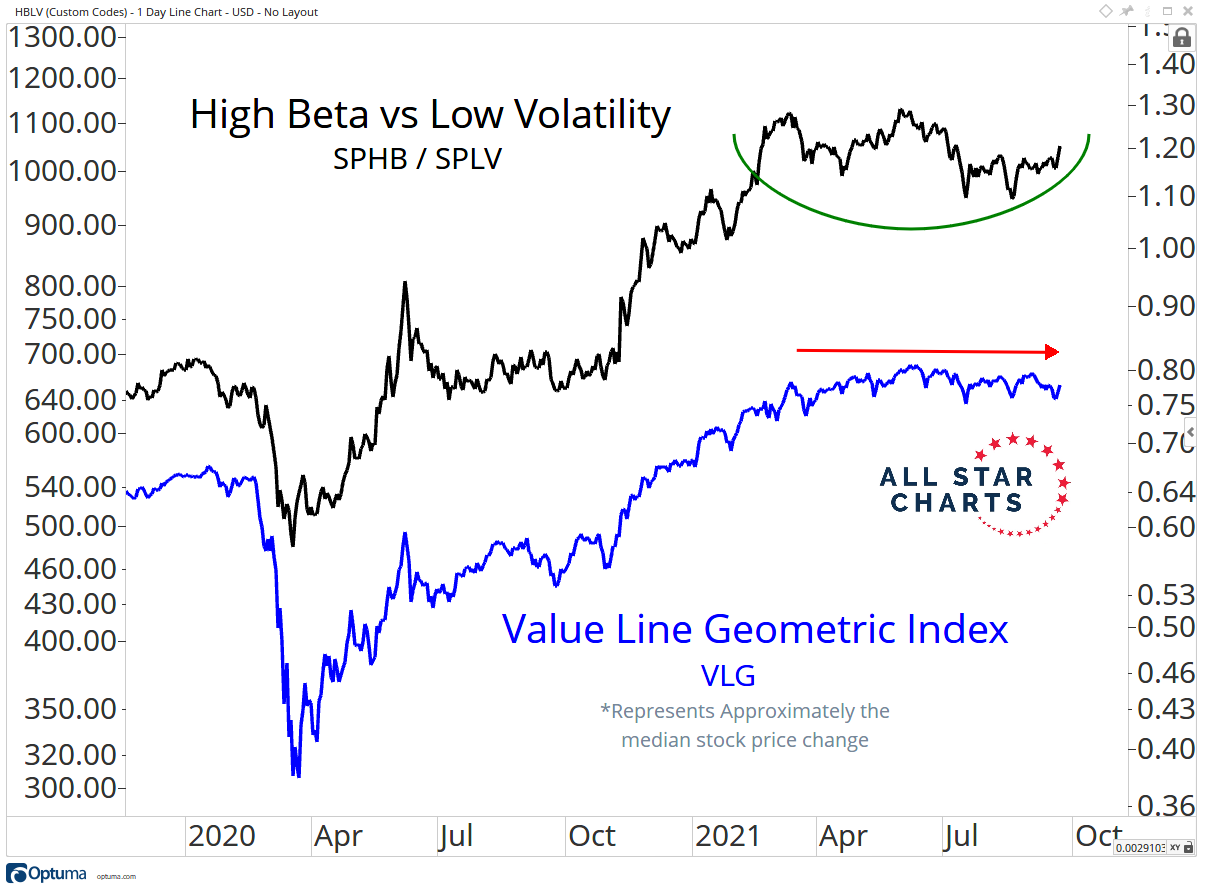
From the desk of Steve Strazza @Sstrazza and Grant Hawkridge @granthawkridge
Considering the selling pressure in recent weeks, we were very excited to take a look at our breadth indicators today to see if we finally saw some downside expansion worth pointing out. Spoiler alert: There was nothing there.
Being as we’re in a sideways market, we’re always on the lookout for a change in character in internals that might suggest some resolutions are finally on the horizon. And since bears have been driving stocks lower since early this month, our focus is on new short-term lows.
With the S&P experiencing some volatility and revisiting its 50-day moving average this week, did we finally get that “fall day?”
Two things we’ve been hitting on ad nauseam for over a quarter now are the consistent lack of new lows and the fact that most stocks have already corrected beneath the surface.
Today, we’re going to revisit both of these key themes and see where we currently stand.
From the desk of Willie Delwiche.
Key Takeaway: Optimism has begun to cool as sentiment relieves the excesses of early summer. Yet, we are a far cry from a complete unwind that cyclical damage suggests is necessary. As investors become more risk-averse, we are looking for evidence that pessimism has become widespread and excessive (more II bears than bulls, NAAIM Exposure Index reading below 30, ETF outflows close to or below zero on a 4-week basis, and a daily close in the VIX greater than 30). Though there is certainly an increased level of caution and concern among market participants, we haven’t seen a degree of fear or pessimism in any of our indicators that point to the warranted rebalance. For now, risks remain elevated as sentiment swings toward pessimism.
Sentiment Report Chart of the Week: Risk Appetite In Retreat
My son is playing soccer right now, and one of the things I hear over and over from the coach during games are reminders to spread out and pay attention to positioning. The same is true in the market. When everyone gets bunched up in the same position, opportunities for success fade. Data through Q1 shows investors historically high levels of equity exposure. Q2 data will be out later this week and I expect the imbalance will have increased. This sort of excessive positioning can weigh on future equity market returns.